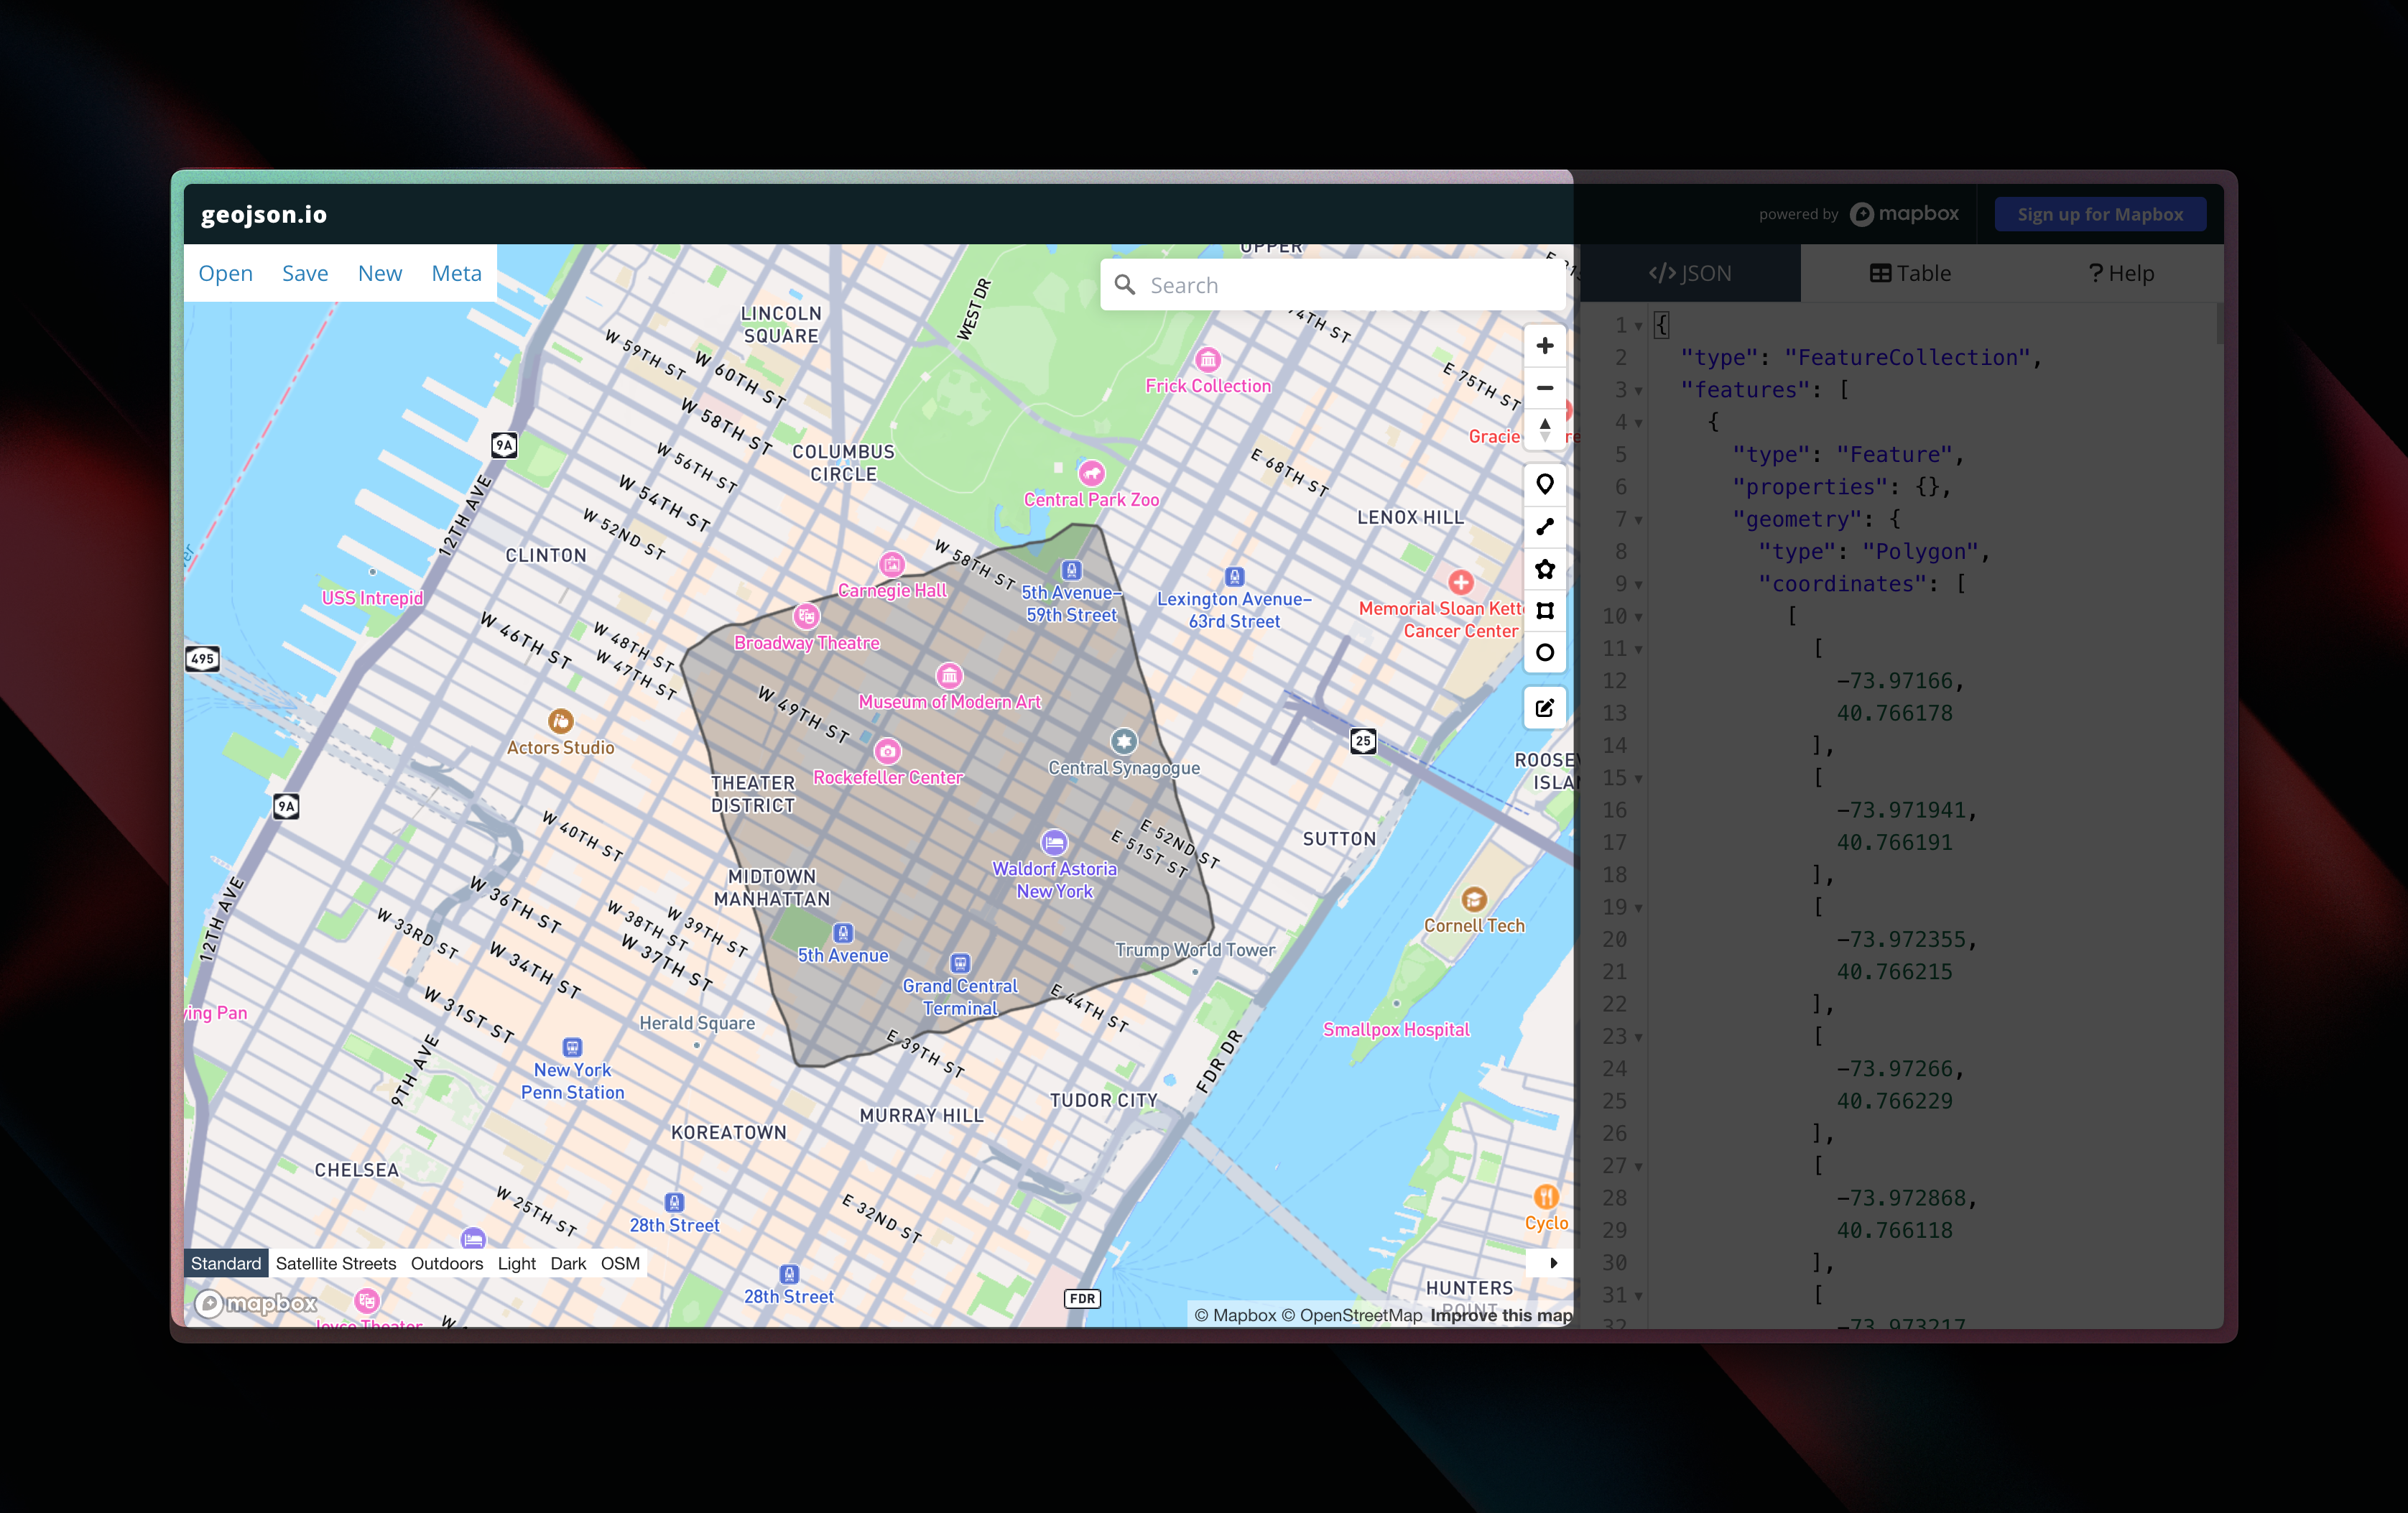
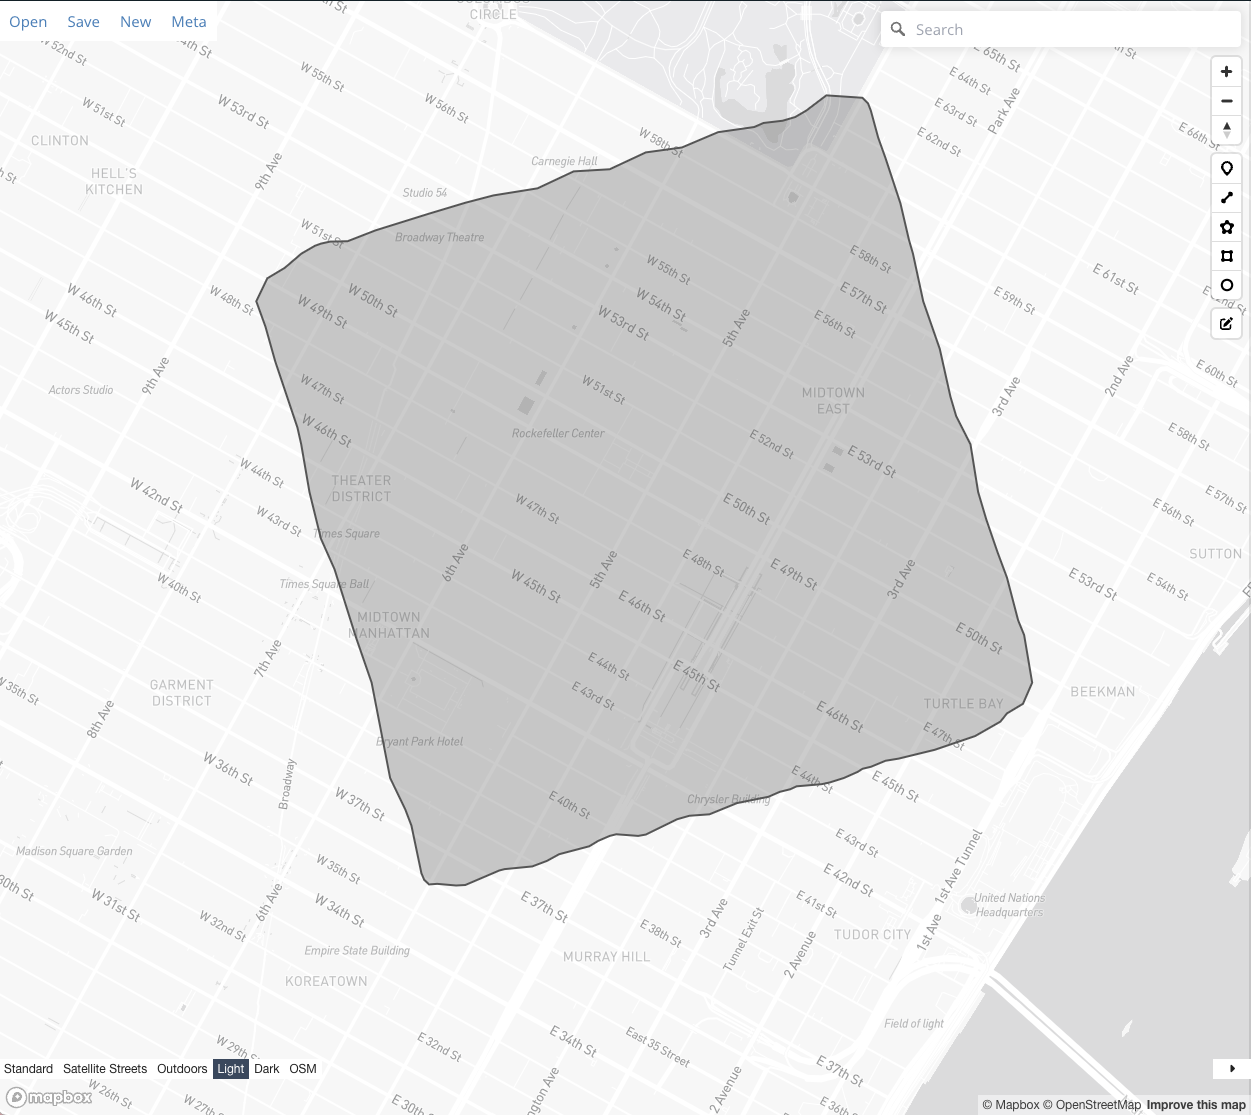
The 1000-meter walking distance around Rockefella
For every row in your dataset you will call a MapBox API. In other words, the tool will take longer time to run with many records. We strongly recommend testing on smaller datasets.We have built-in restriction to handle rate limits for a single tool. However, you should be cautious if you run multiple models at the same time using the MapBox tool suite.You are responsible for respecting the Terms of Use specified by MapBox when you use the MapBox - tool.
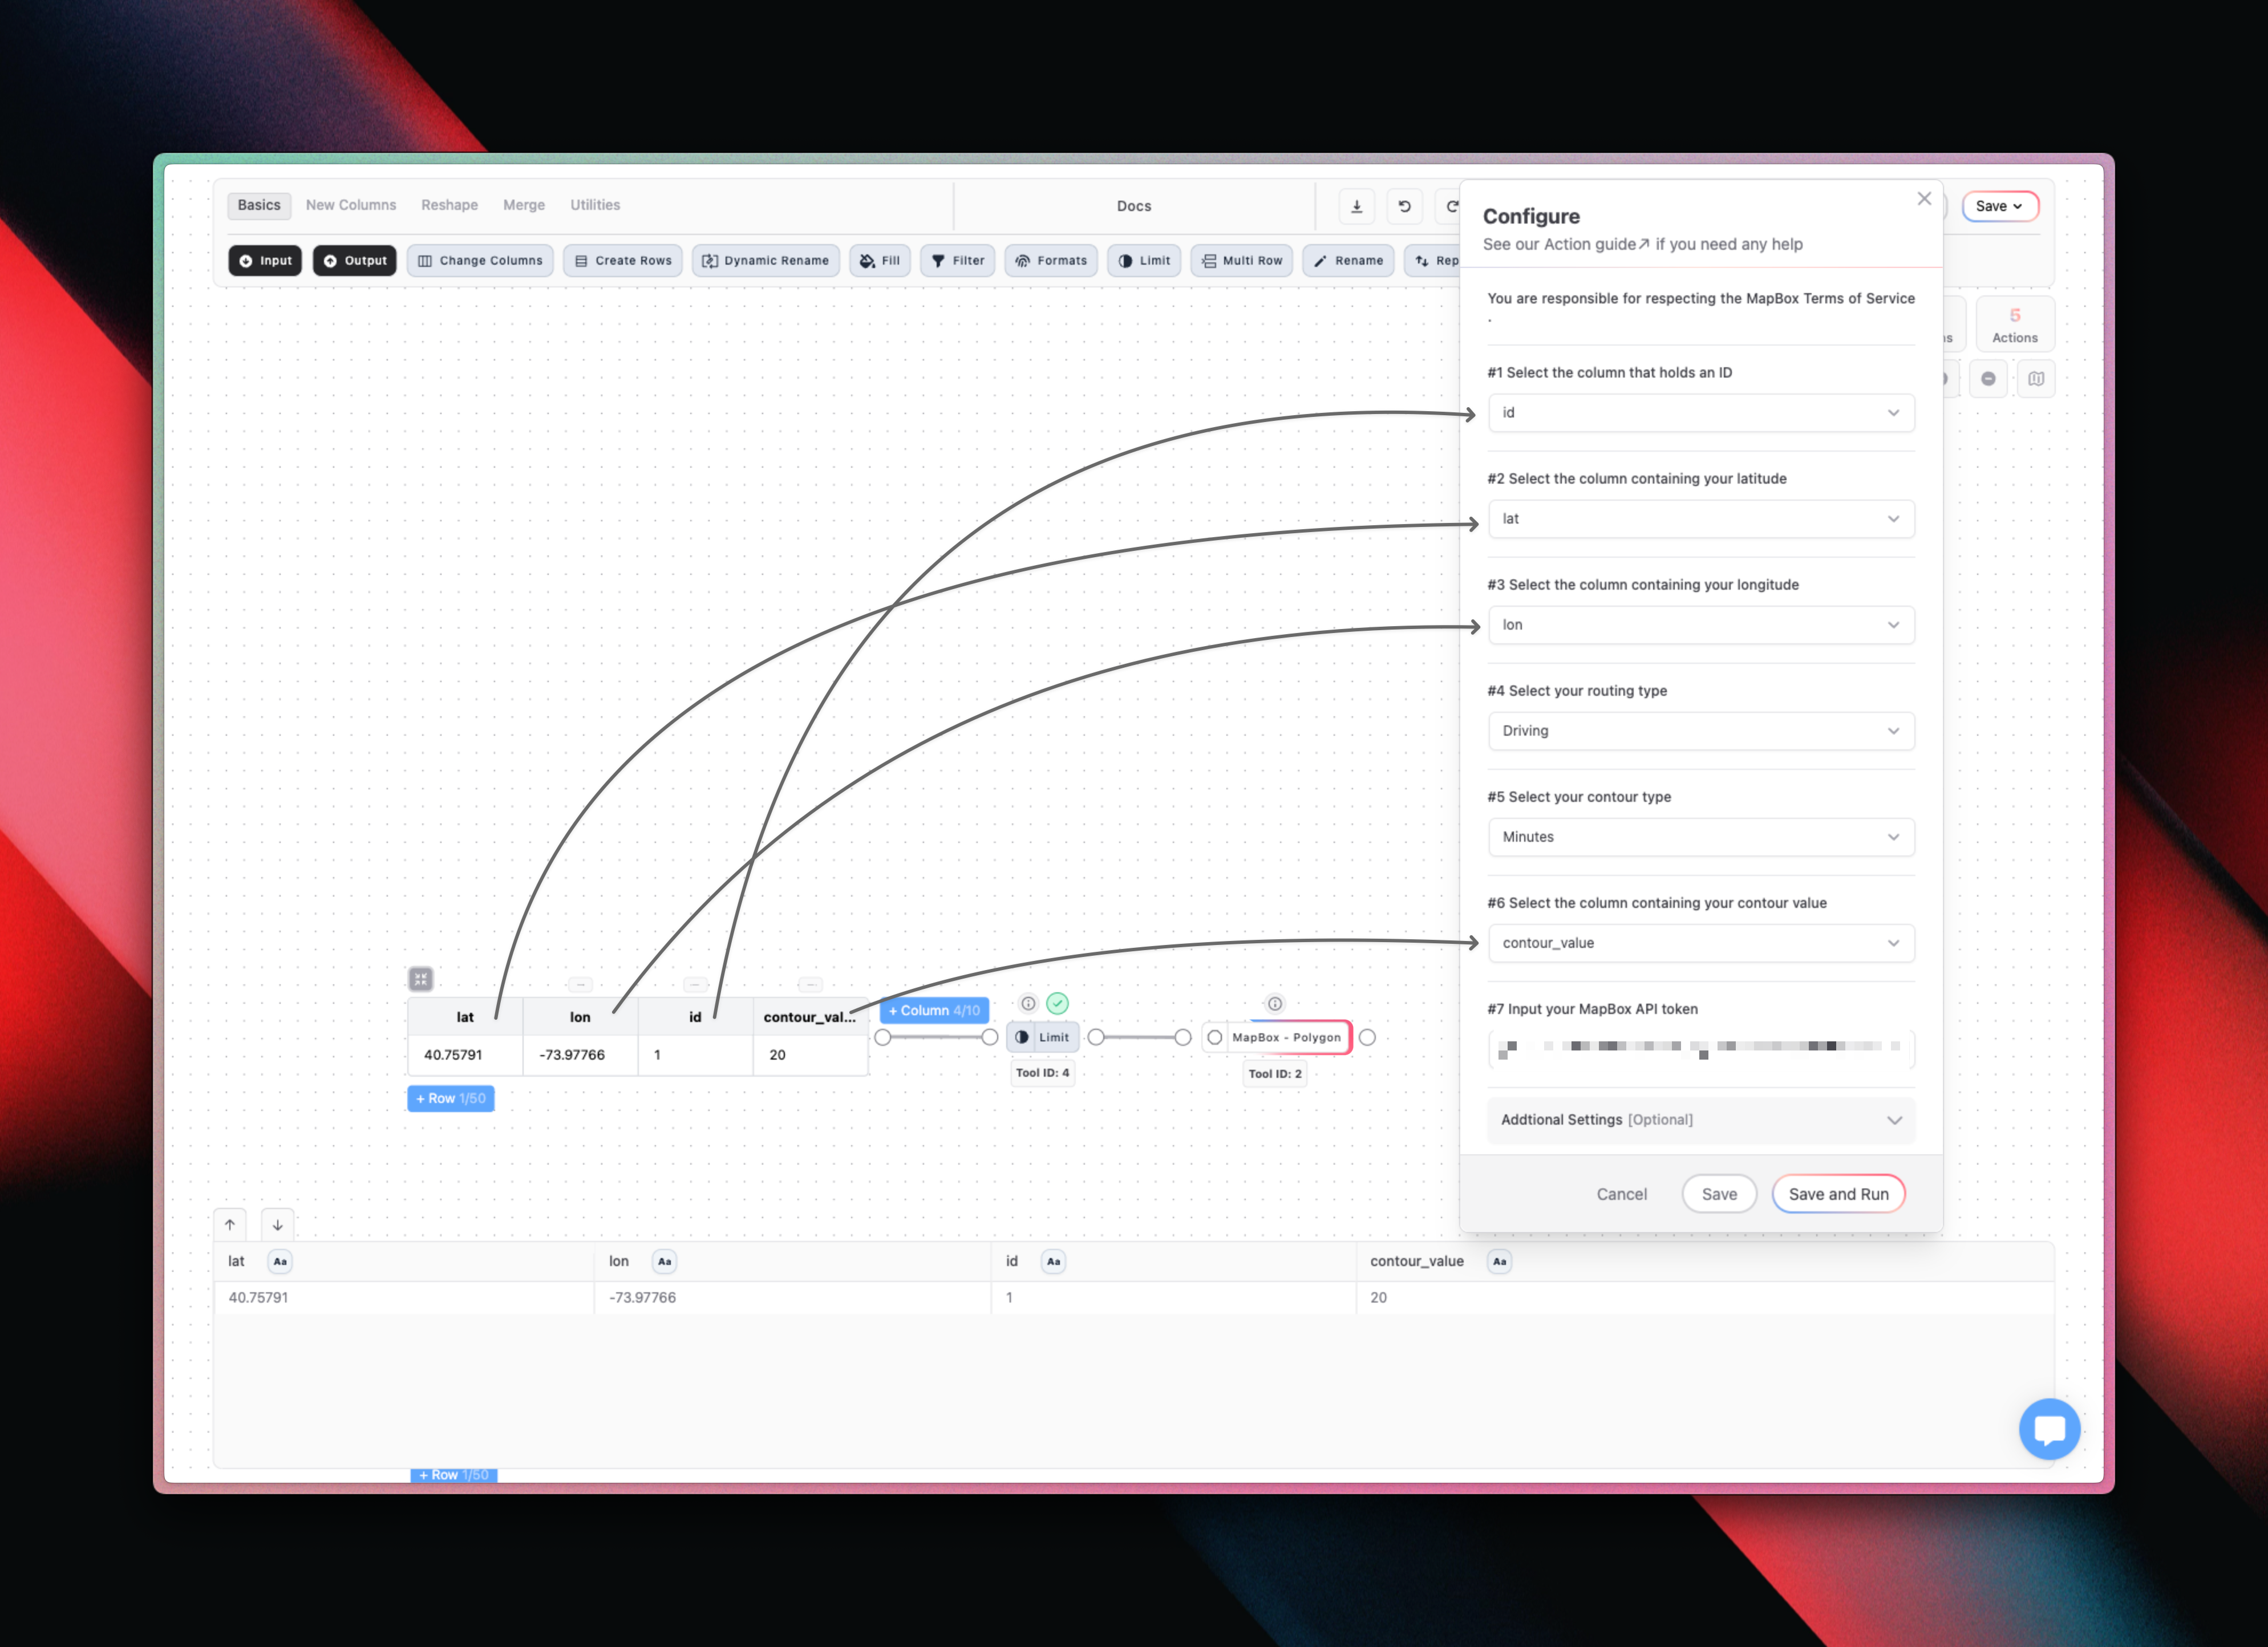
Configuration
The MapBox - Polygon tool consists of seven required input.1
Select ID Column
Select a column containing an ID. Use the Row ID to generate one if you don’t have one in your dataset.
2
Point Latitude
Select the column containing the latitude of the point around which you want to create an area.
3
Point Longitude
Select the column containing the longitude of the point around which you want to create an area.
4
Select Routing Type
Select your routing type. You can choose between Driving, Driving (Traffic), Walking and Cycling. Your selection will determine the size of the area - you will get a larger area if you select driving as opposed to walking because you can cover a larger area driving versus walking.
5
Select Contour Type
This selection determines the unit of your column selection in Step #6. Select meters if want a distance of x meters around a point and select minutes if you want the area to represent how far you can get from the point in x minutes (depending on your routing type) .
6
Select Column with Contour Value
Select the column containing the value in either meters or meters that defines how large your polygon will be.
7
Input MapBox API Token
Input your MapBox API Token.
How to create a MapBox API Token
How to create a MapBox API Token
1
Create Account
Go to https://www.mapbox.com/ and create an your own account.
2
Navigate to Tokens
After you have logged in, navigate to Tokens.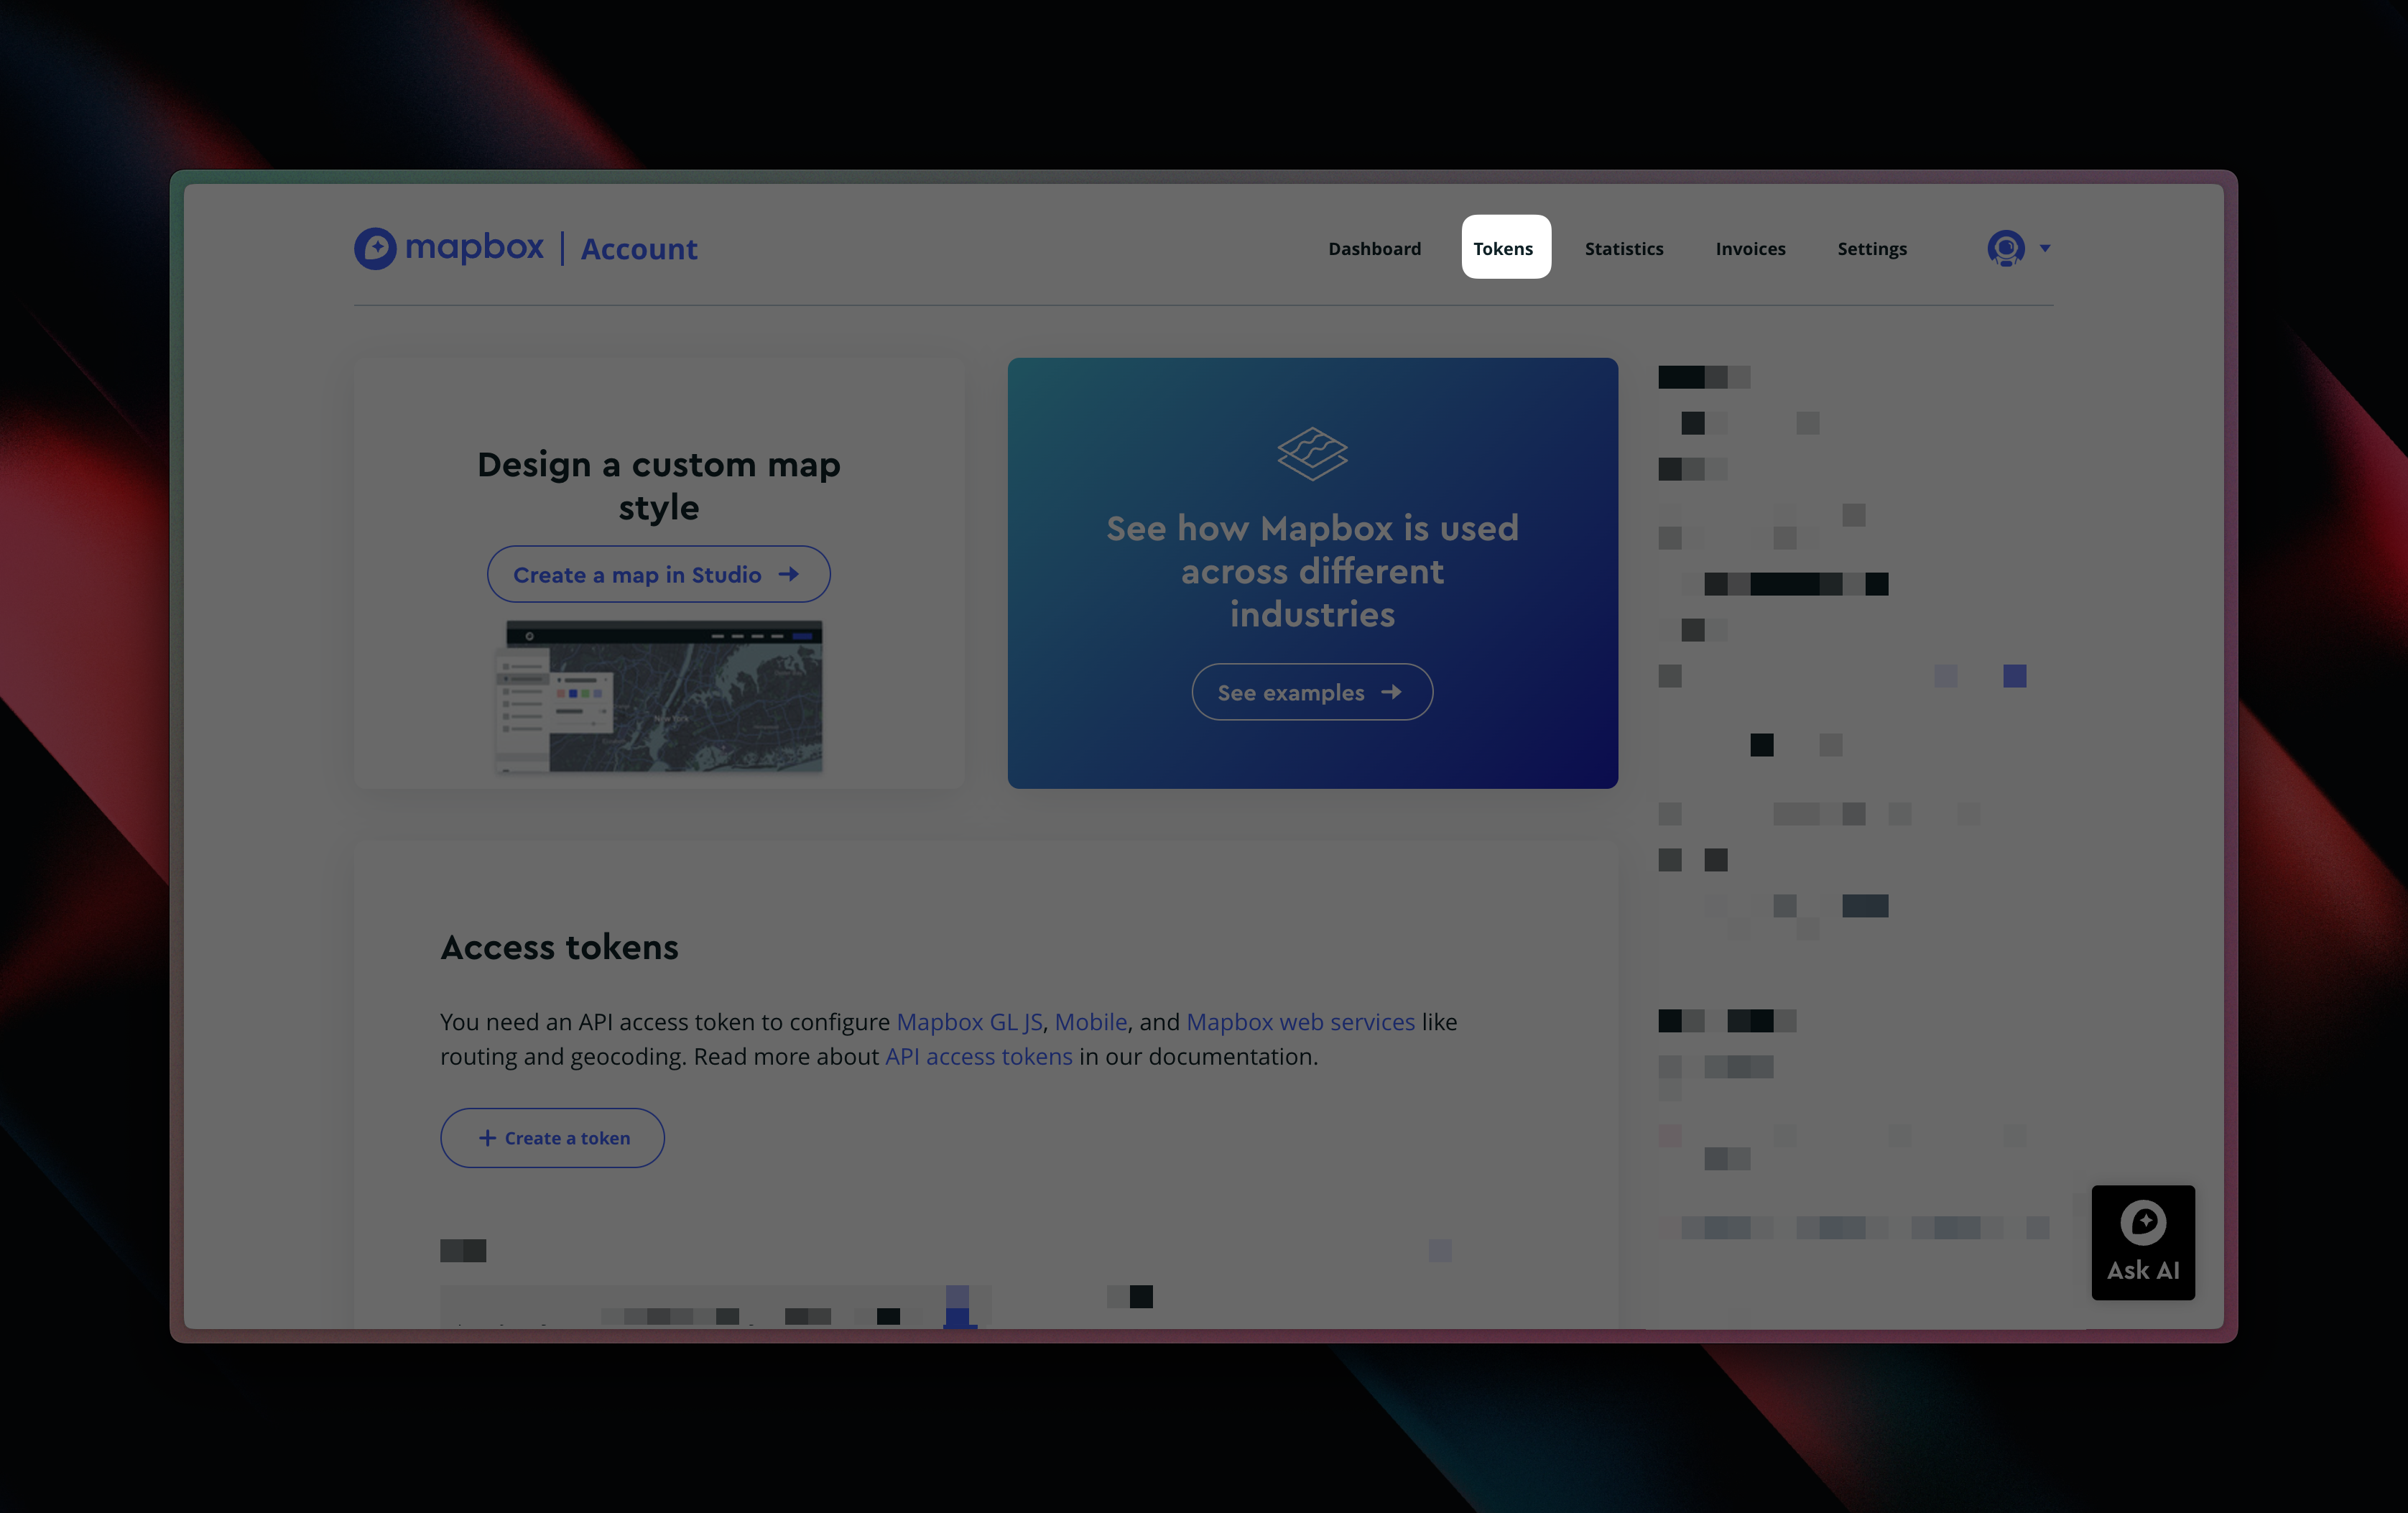
3
Create New Token
Click the Create a token button.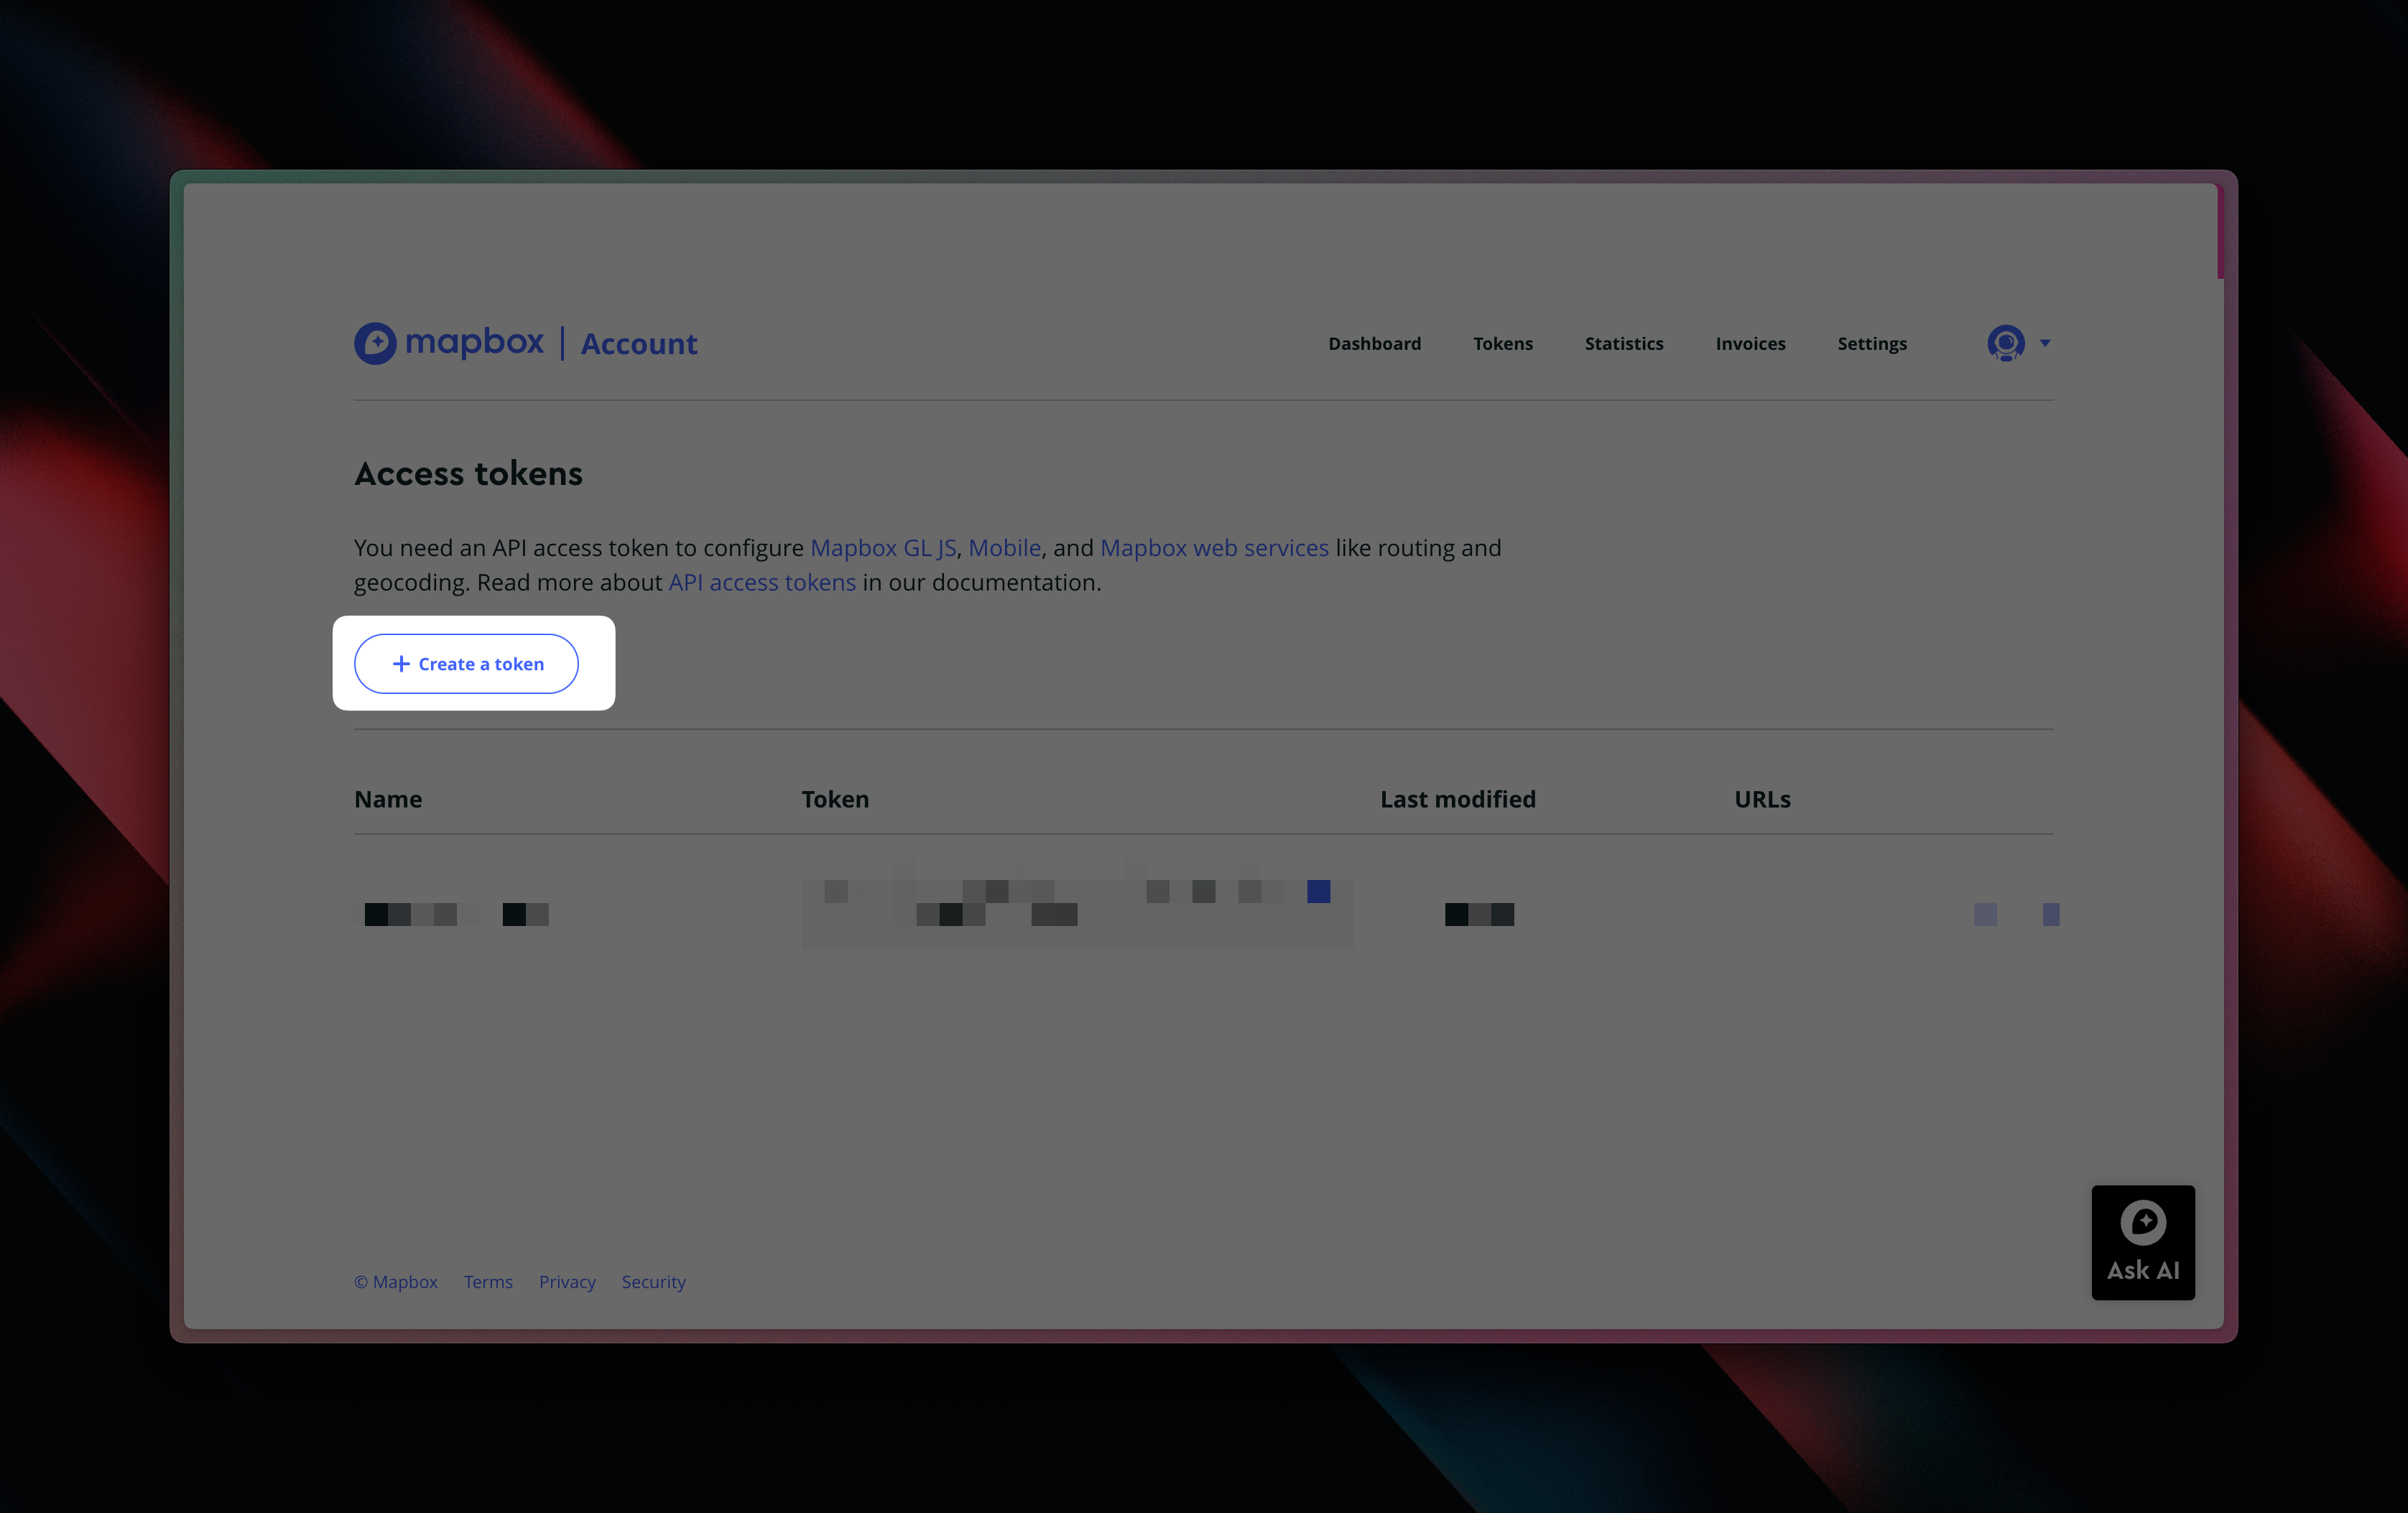
4
Configure New Token
Name your new token and just leave the rest of the settings as they are by default.
5
Copy/Paste Token
You’ve created your MapBox token and can copy this into the configuration inside Less.
8
Advanced Settings
There are a number of advanced settings available to customize the shape of the area being created.
When To Use
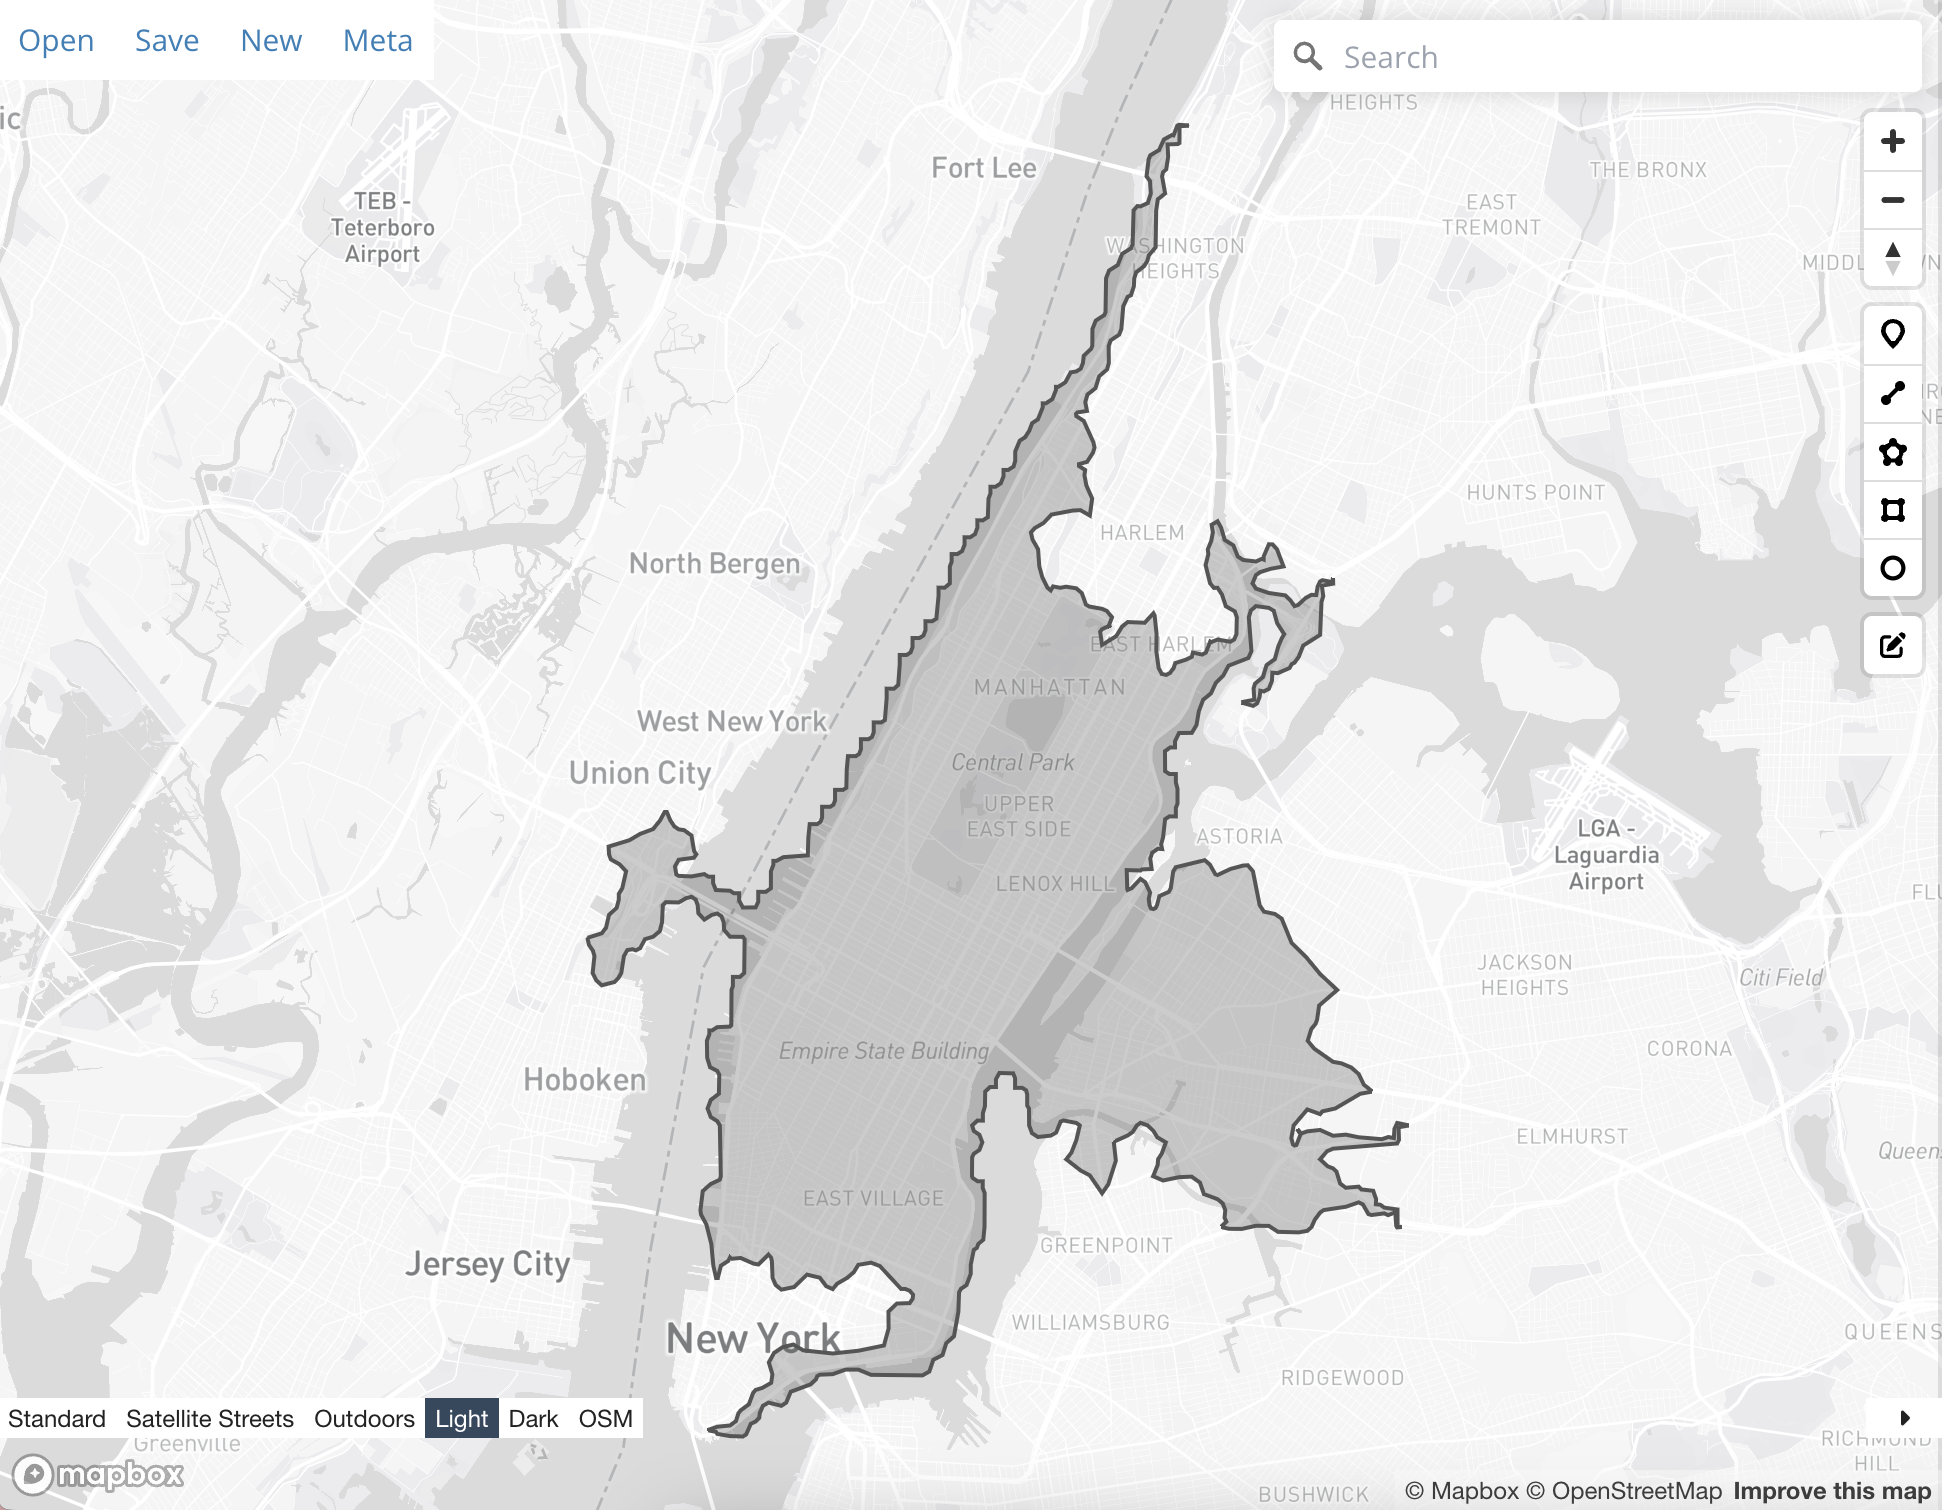
The usage of the MapBox - Polygon tool is relatively narrow.- The MapBox - Polygon can help you create the polygon input for the Point-in-Polygon tool
- You want to visualise an area in a visualisation tool
Examples
1000-meters walking
1000-meters walking
I would like to create a 1000-meter walking distance area around a point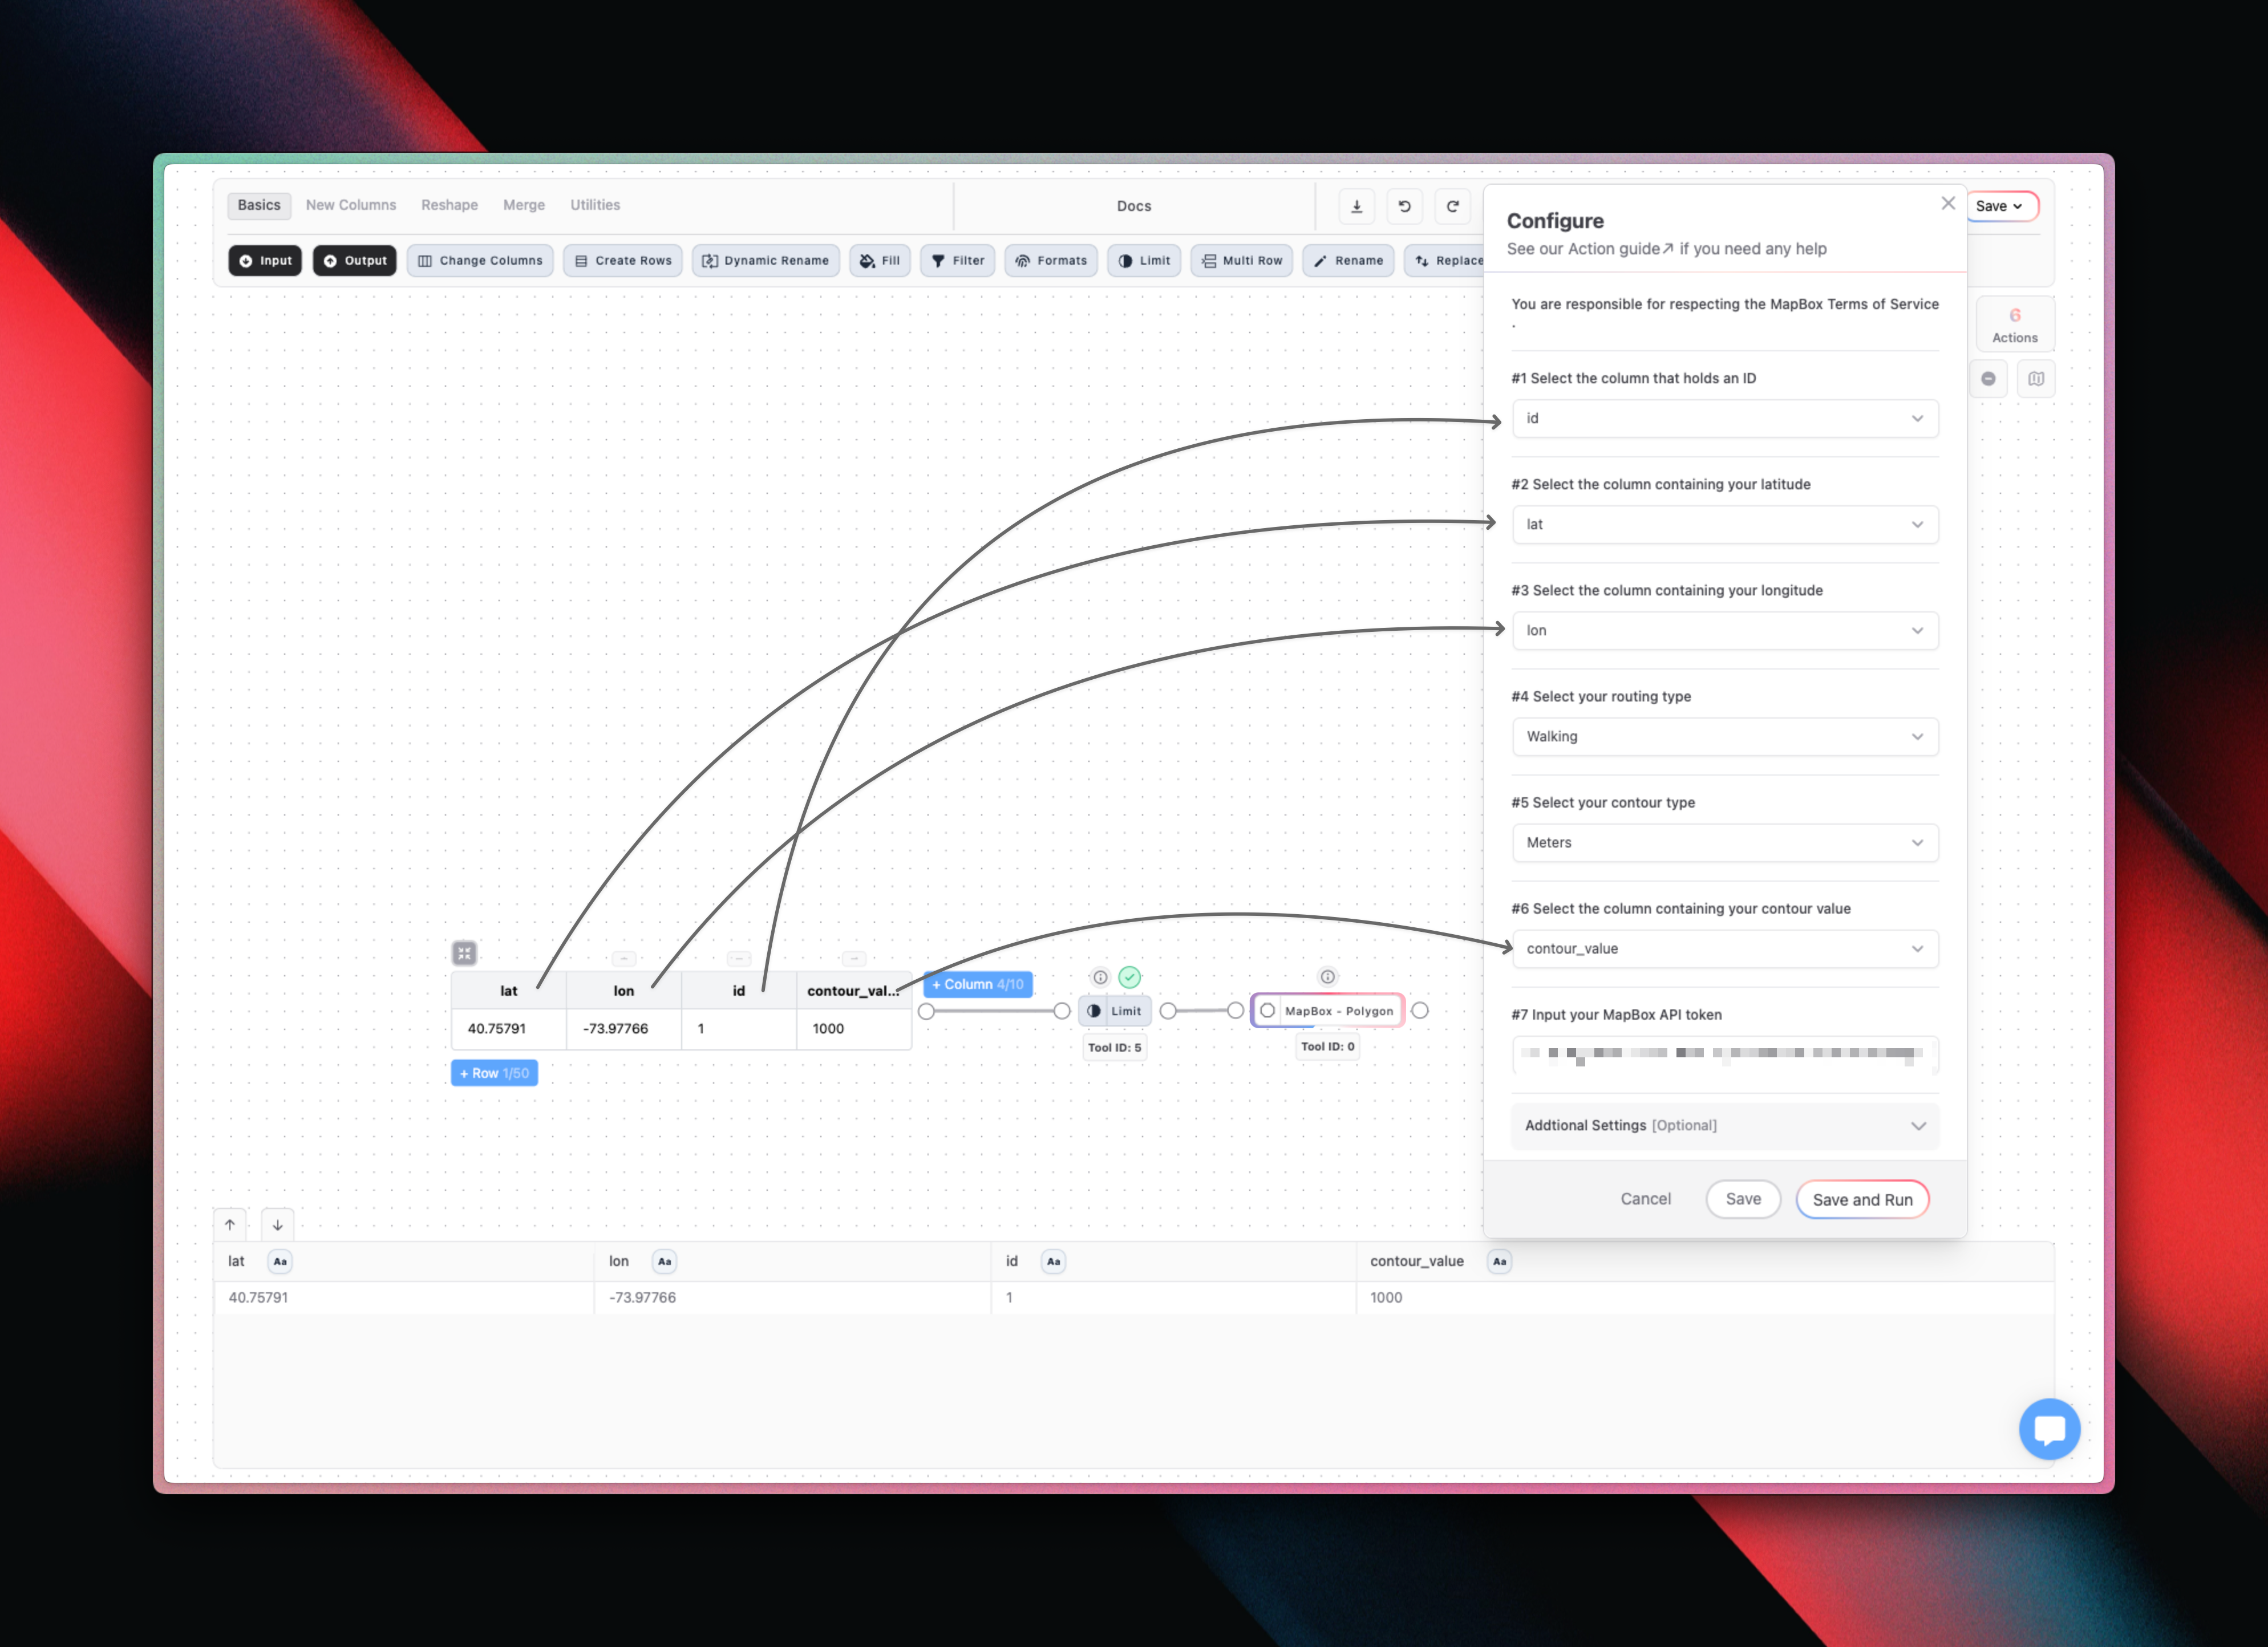
20-minutes drivetime
20-minutes drivetime
I would like to create a 20-meter driving distance area around a point