Configuration
Select Column(s) to Group By
Select the column(s) to group by. You can input as many columns as you need. Adding more columns will make your groups/boxes more unique as the “boxes” become more specific.This is technically an optional input. You don’t have to greate any groups if you just want to.
1) Select column, 2) select aggregation and 3) new column name (optional)
Add your aggregation(s) pairs by selecting the column you want to aggregate and how you want to aggregate them.You can choose to rename the output column if you want to.You can choose from the following types of aggregations:
- Sum: summarize numeric values (numeric columns only)
- Average: find the average of numeric values (numeric columns only)
- Min: find the smallest numeric value (numeric and datetime columns only)
- Max: find the largest numeric value (numeric and datetime columns only)
- Count: count the occurances
- Count Distinct: count the unique occurances
- First: get the first value in the group
- Last: get the last value in the group
- Concatenate: get all your string values in a comma-separated cell (text columns only)
- Standard Deviation: find the standard deviation (numeric columns only)
- Variance: find the variance (numeric columns only)
- Median: find the median (numeric columns only)
- Skewness: find the skewness (numeric columns only)
- Kurtosis: find the kurtosis (numeric columns only)
Example: Without groups
In this example, we have a dataset with a number of different columns. We don’t want to group by any columns, so we leave the “Group By” column(s) empty.
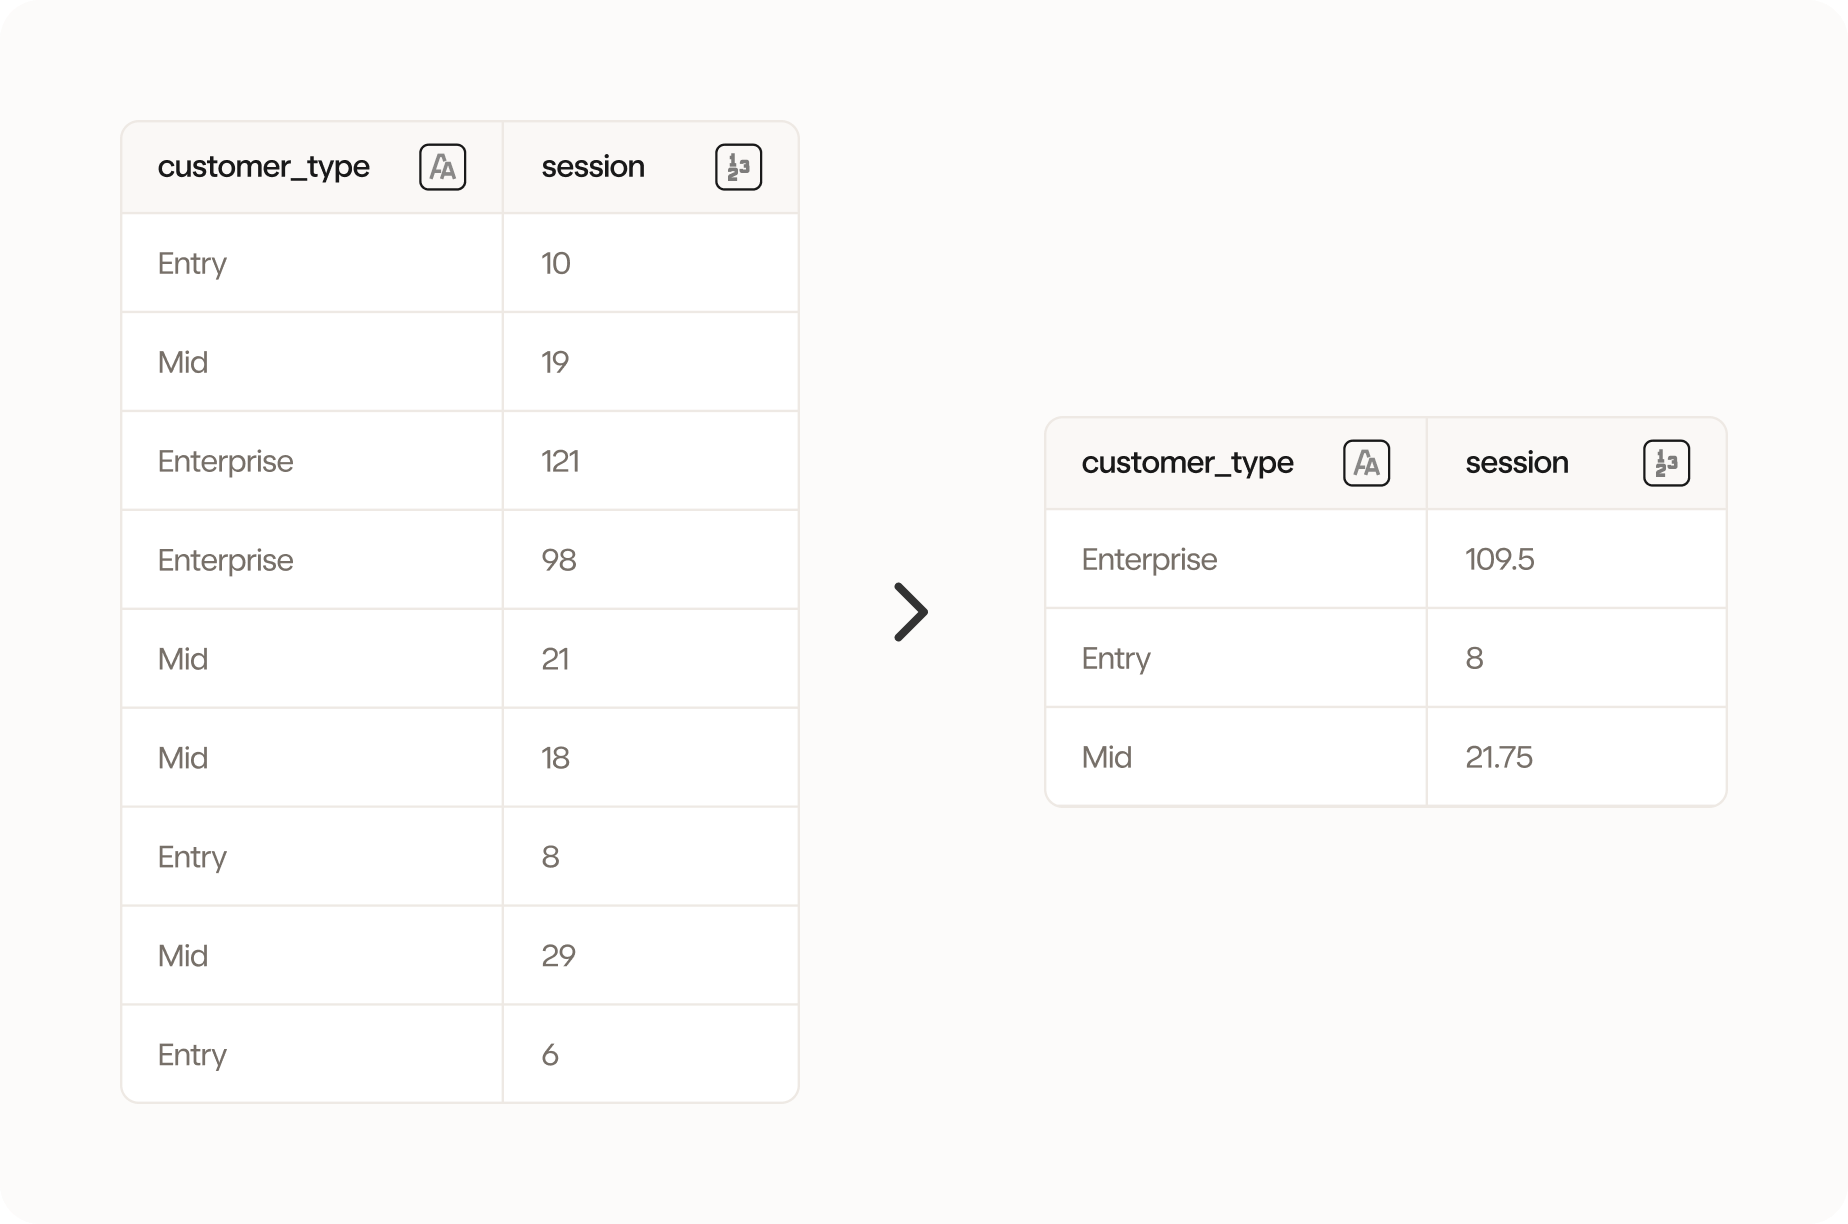
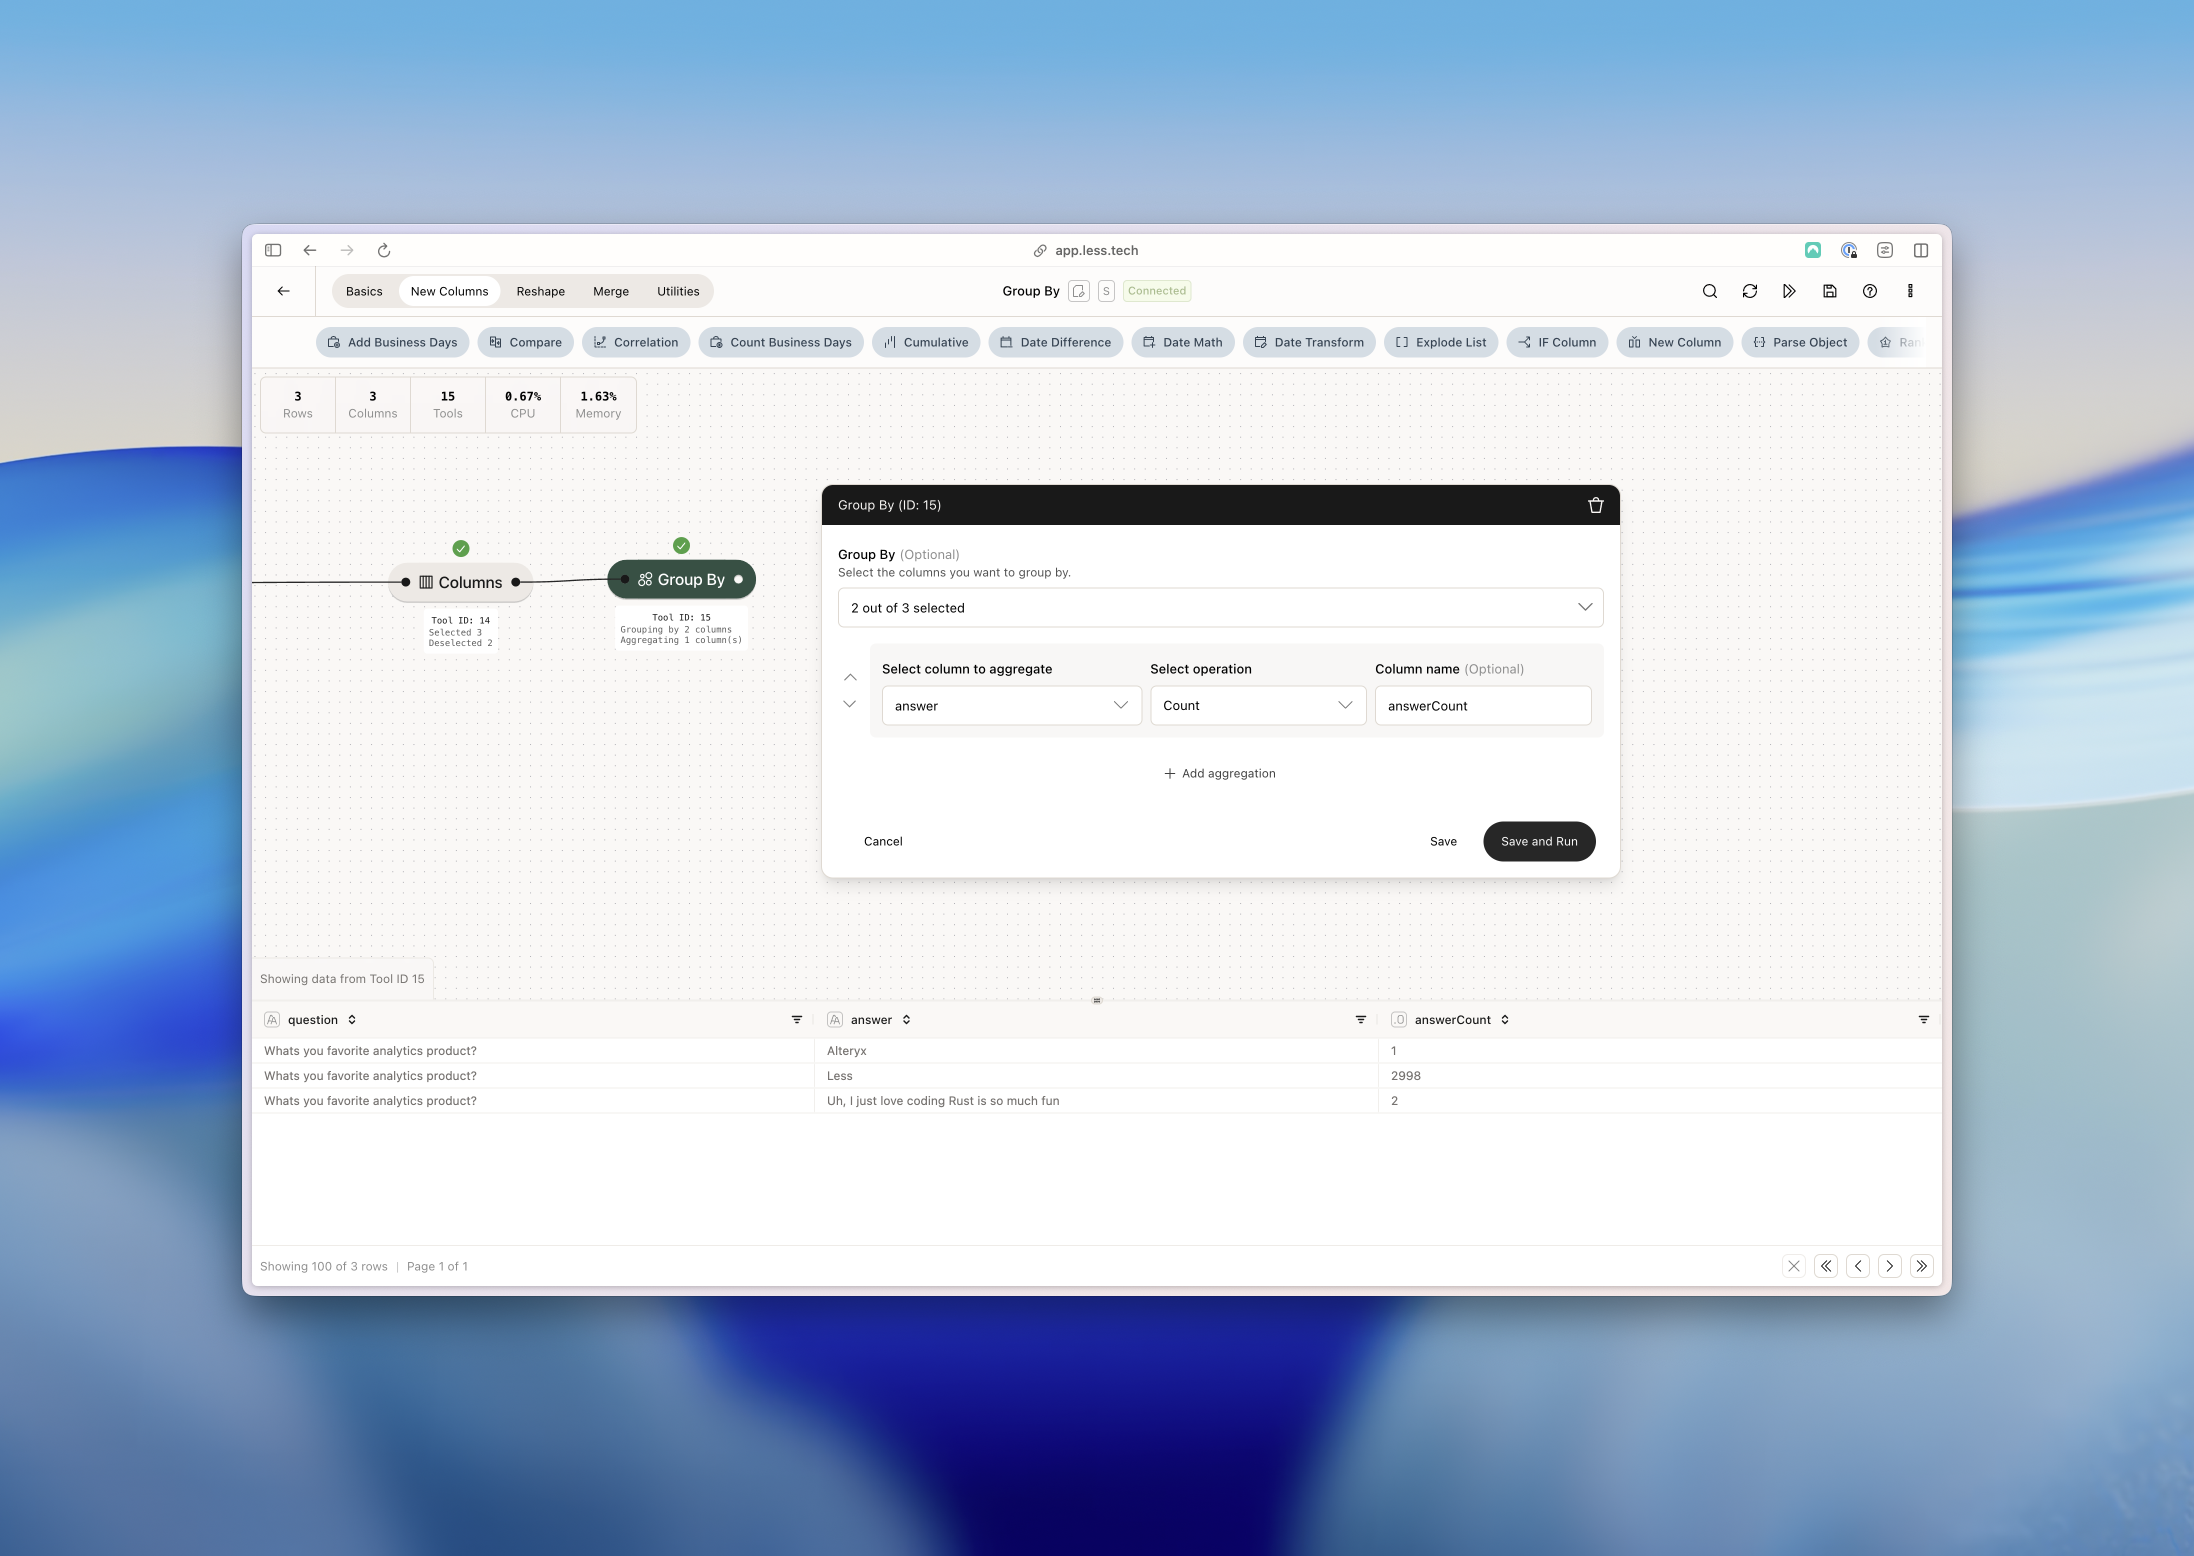
Example: Two groups, counting and renaming
Here we have some questionaire data. We asked some respondents “What’s your favorite analytics product?”. We want to group by the question and answer and count the number of responses for each group. Here you can see our data before we group by - notice that we have 3001 answers.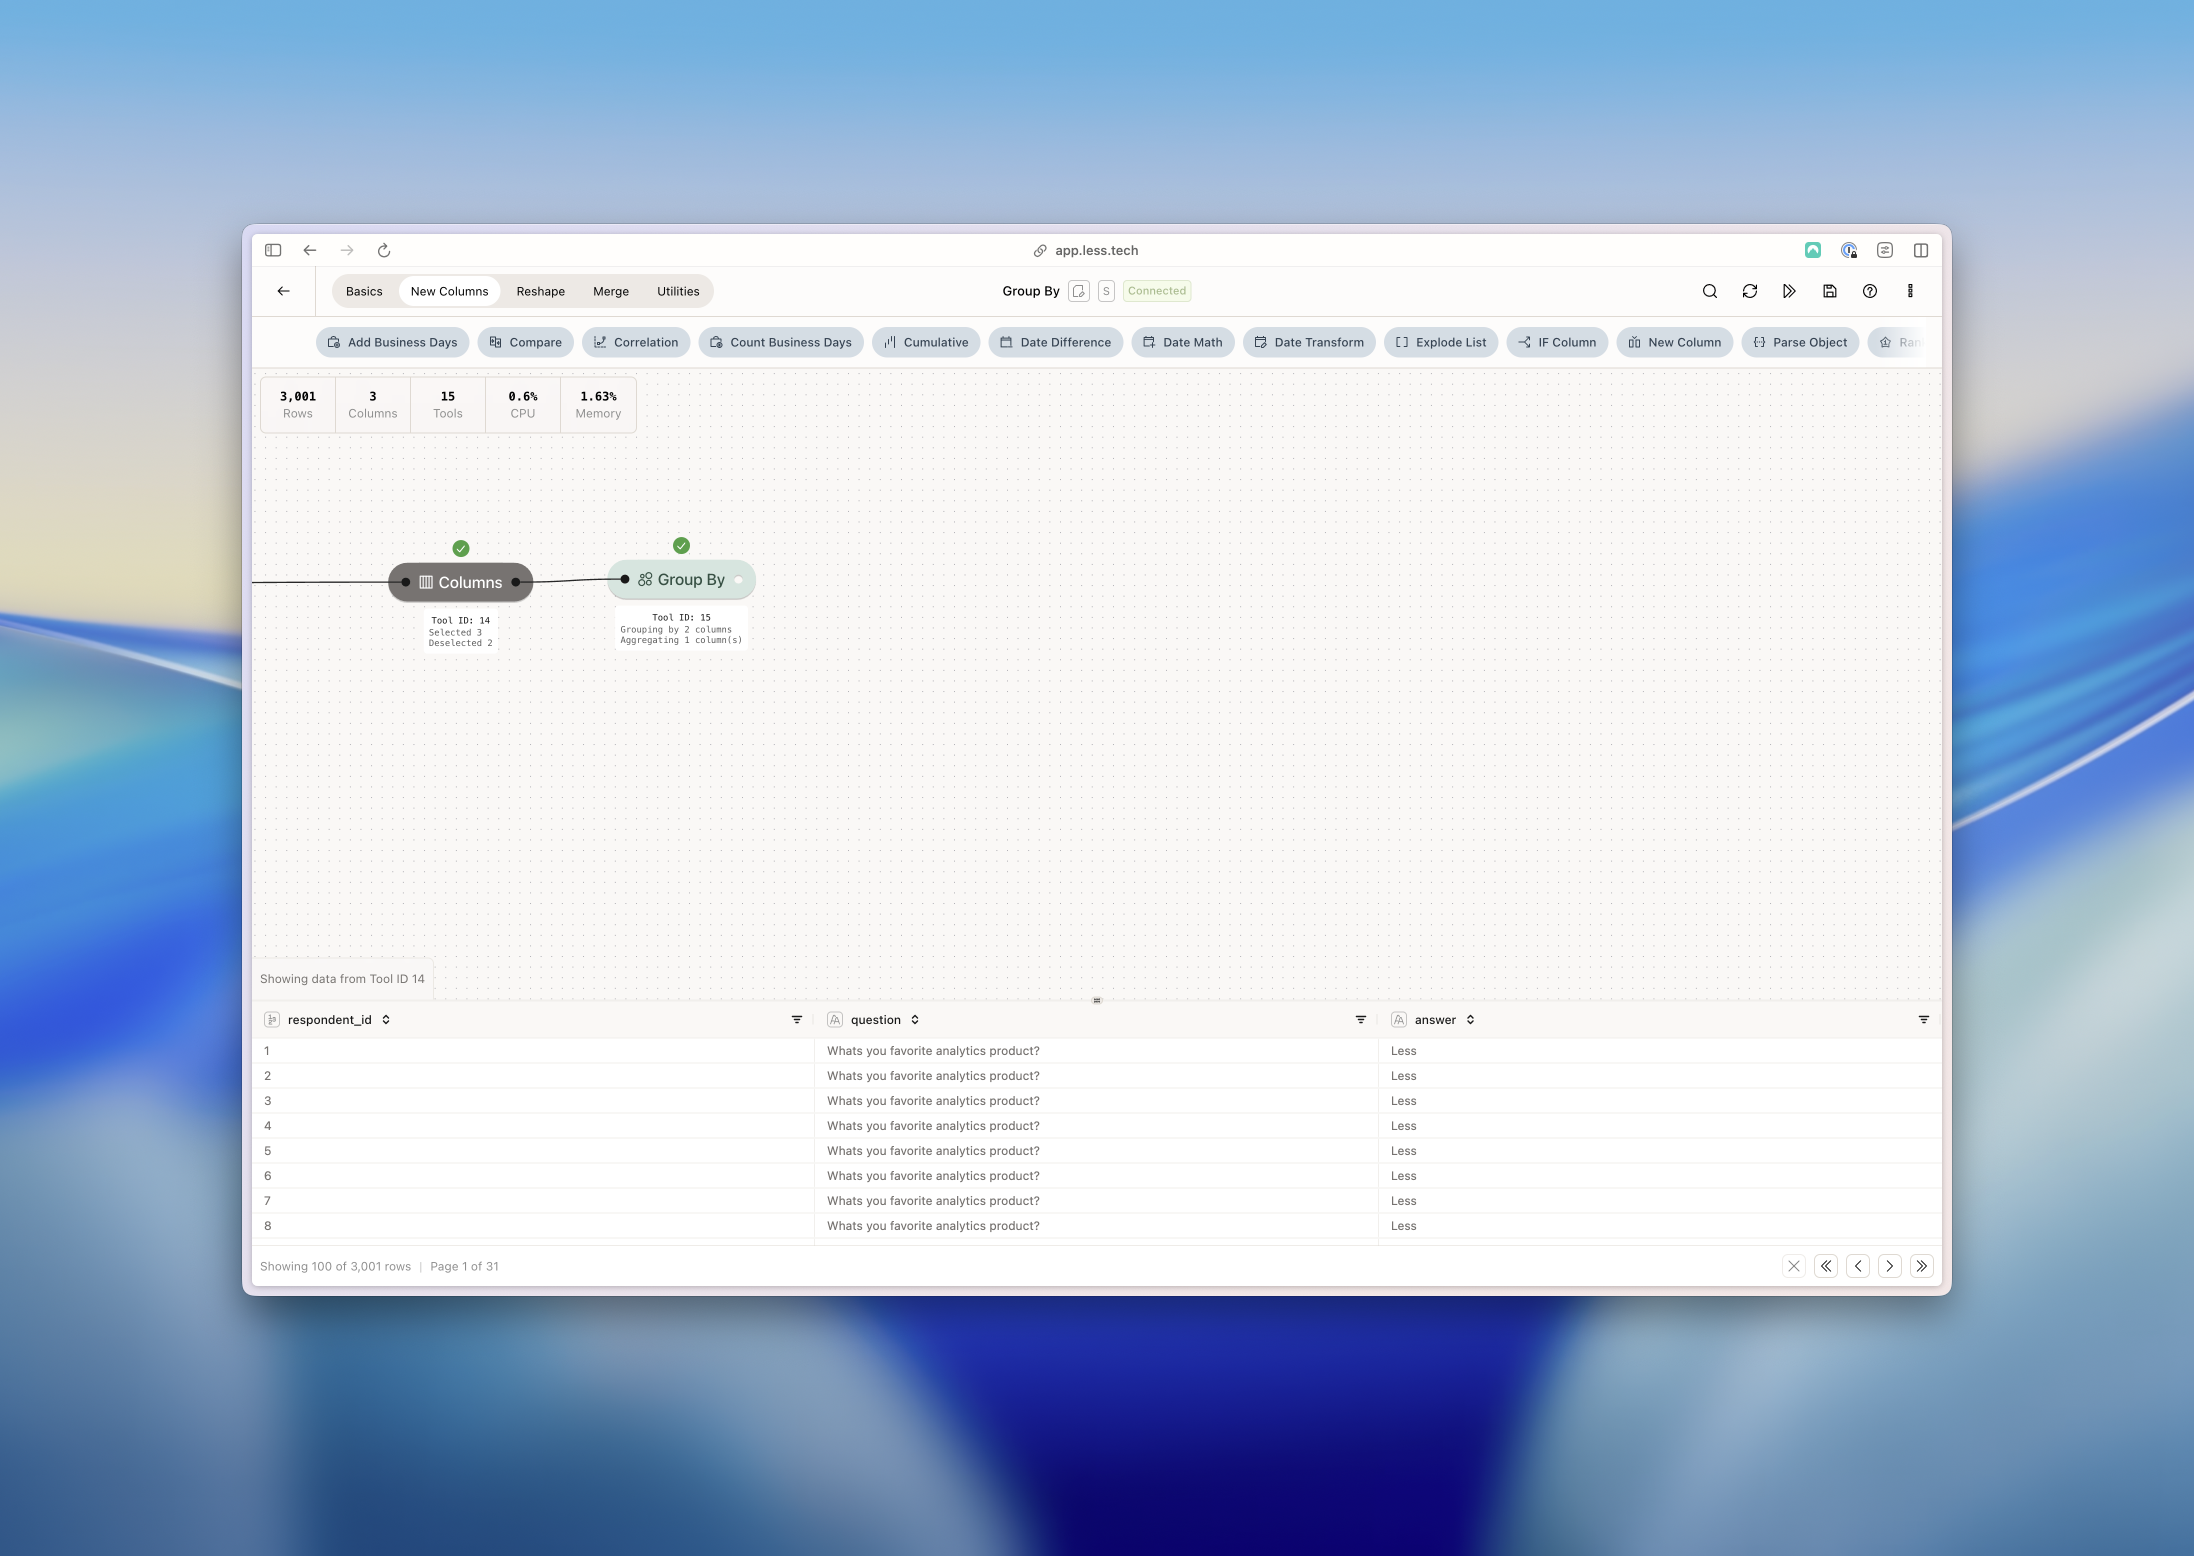
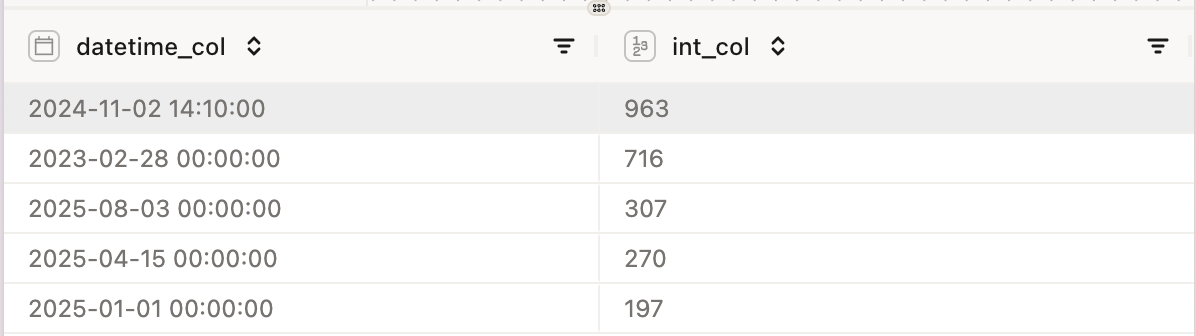
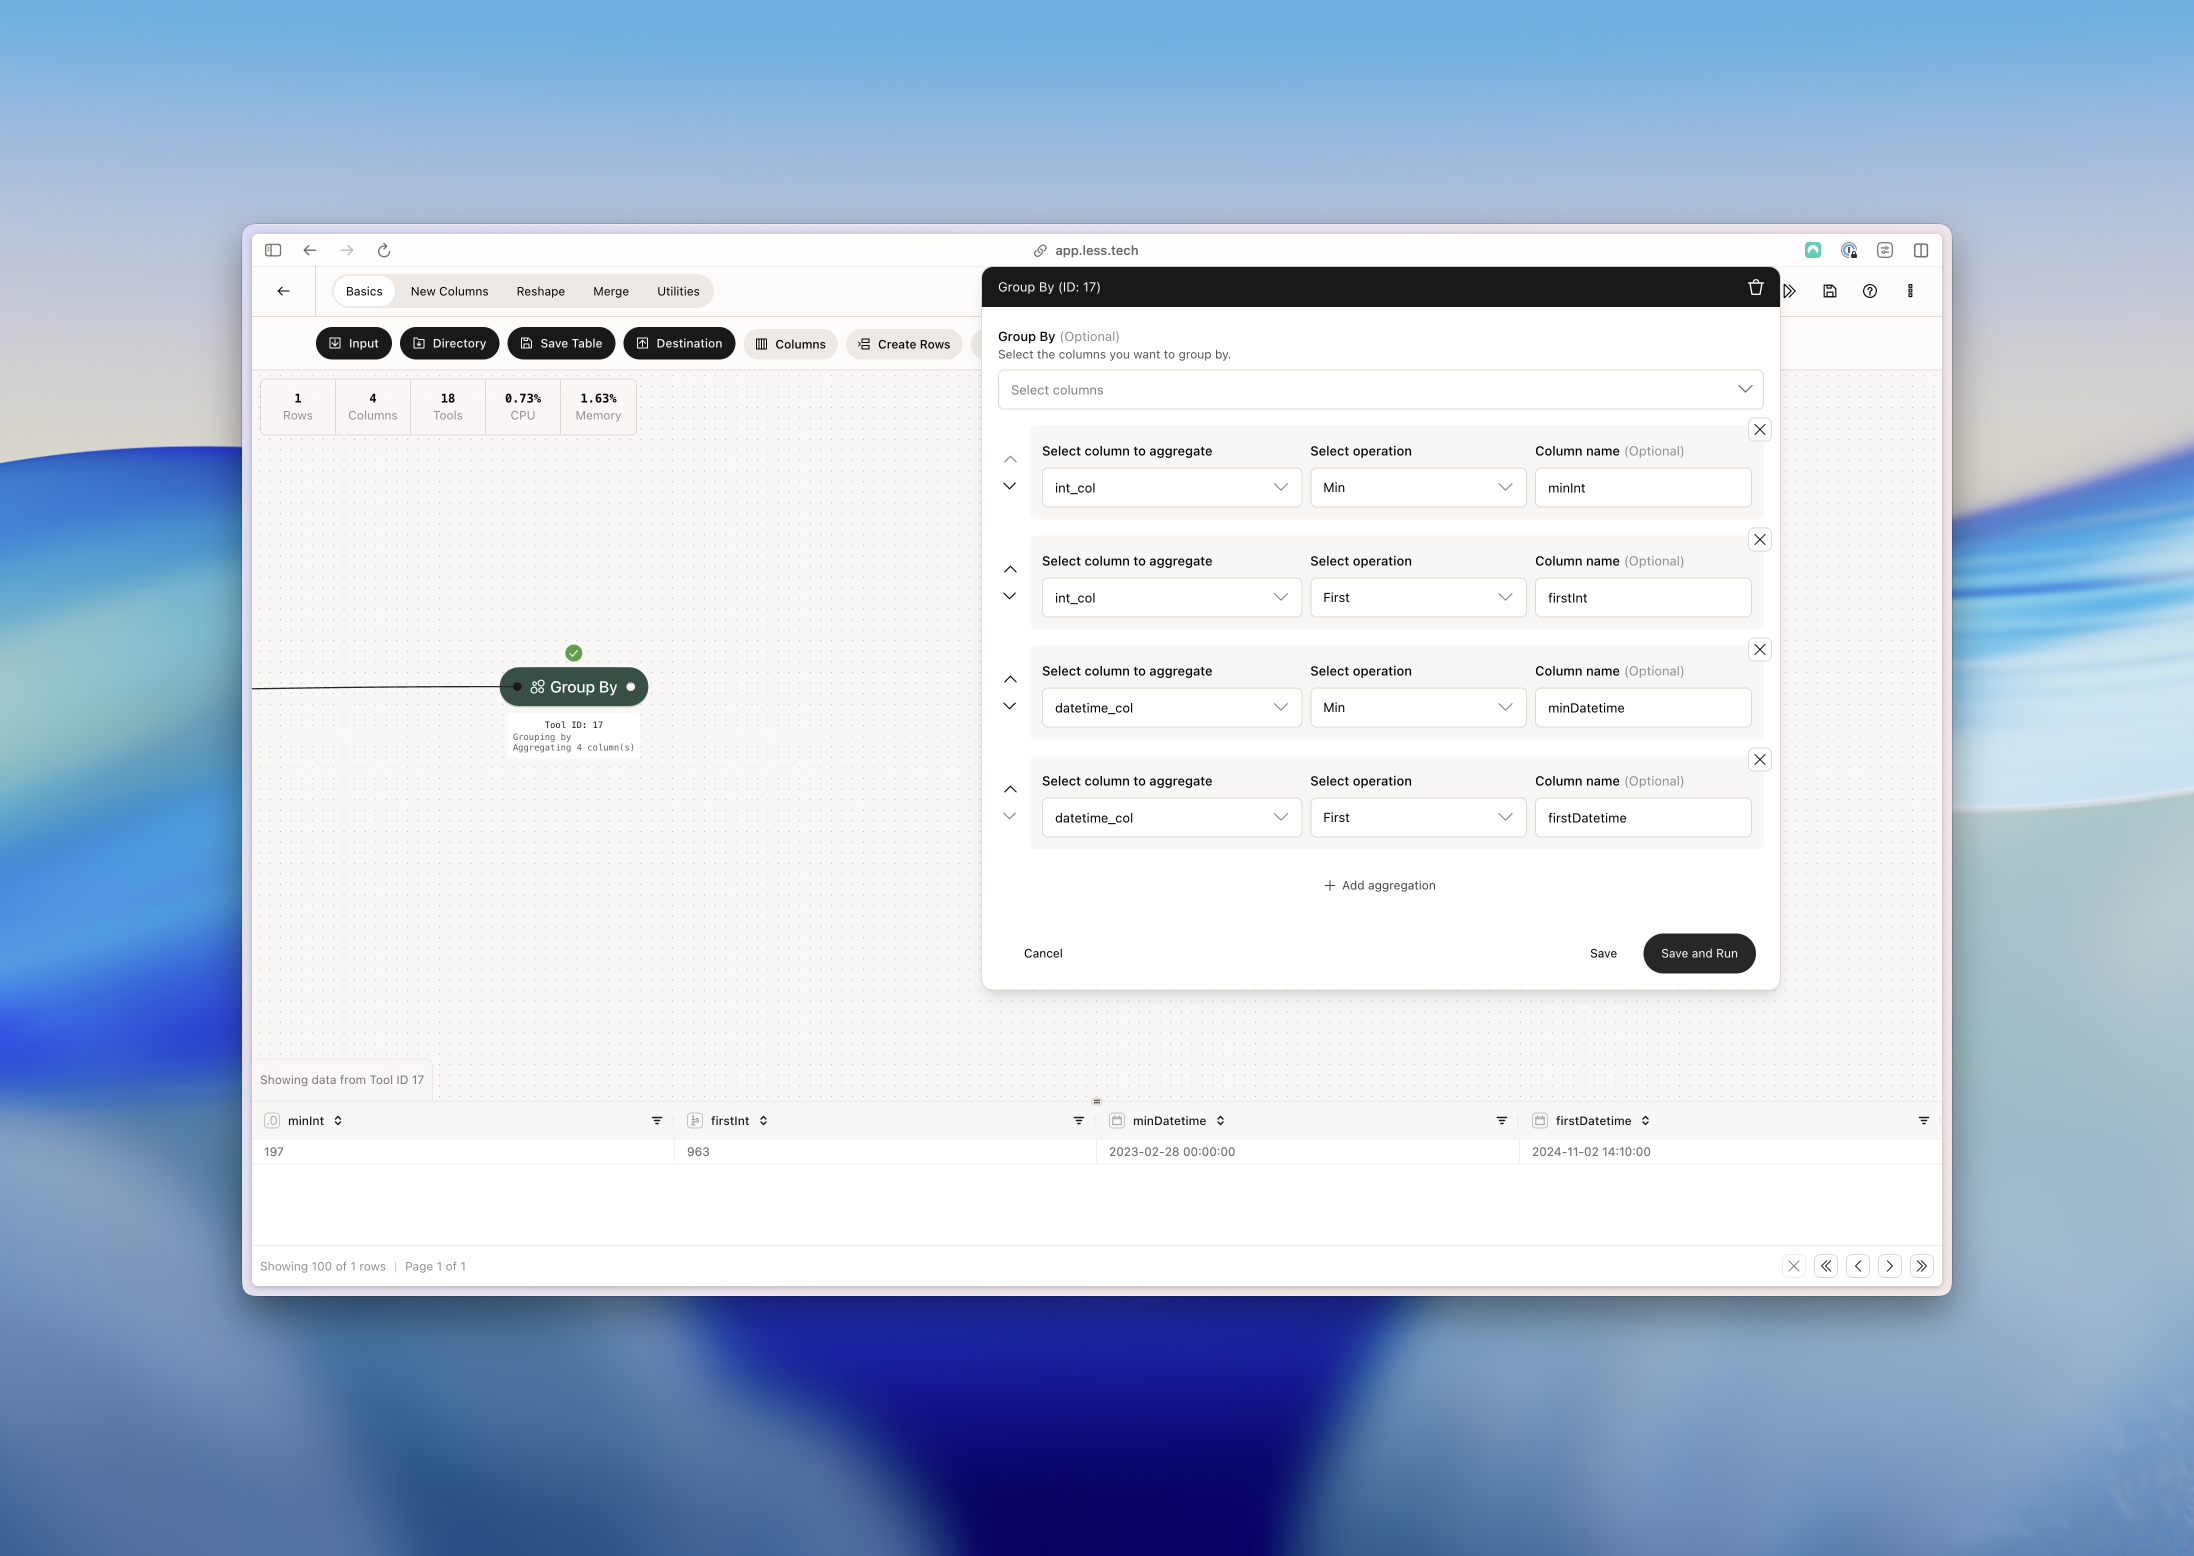
Example: First versus Minimum
There’s a difference between the First and Minimum aggregations. The First aggregation gets the first value in the group, while the Minimum aggregation gets the smallest value in the group. We have this dataset: