Configuration
Operation
Select the operation you want to perform. You can choose between the following operations:
- Cumulative Sum (running sum of the values of the column)
- Cumulative Average (running average of the values of the column)
- Cumulative Minimum (lowest running minimum value of the column)
- Cumulative Maximum (highest running maximum value of the column)
- Cumulative Product (running multiplication of the values of the column)
- Cumulative Count (running count of the values of the column)
Reverse
You can choose to reverse the cumulative calculation whereby you start from the bottom of the dataset and work your way up (instead of default - from the top).
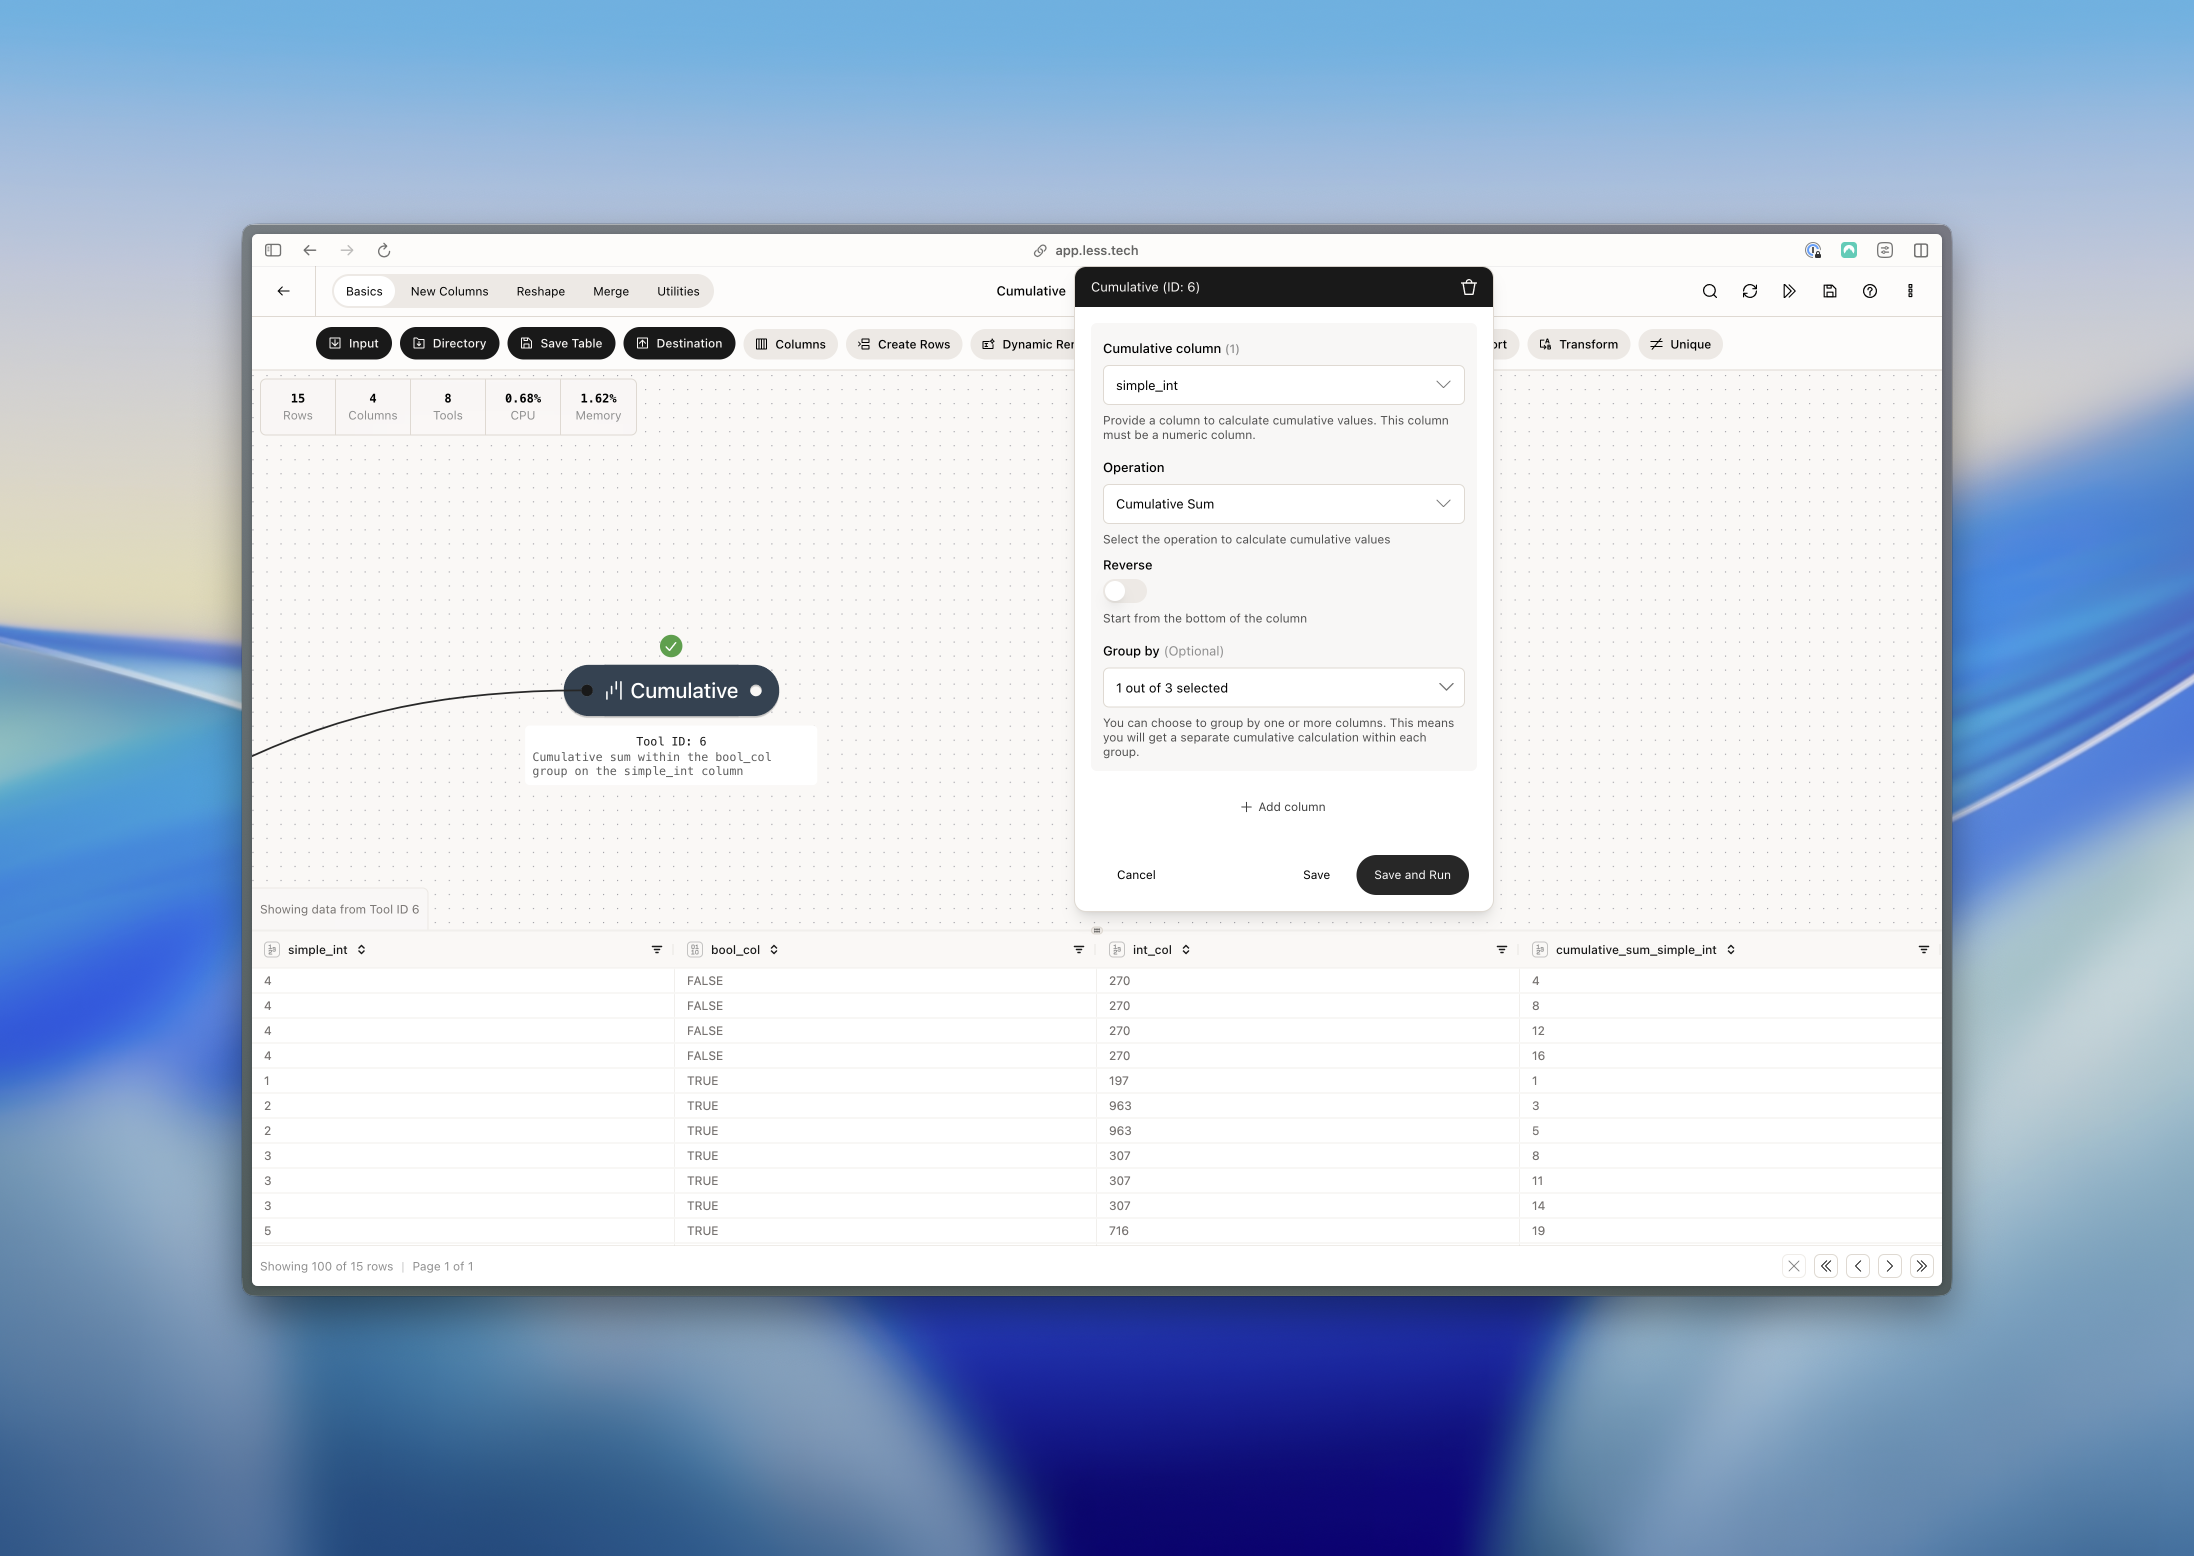
Example: Cumulative sum within a group
In this example we want to sum our simple_int column within each group of the bool_col column.