The Create Rows tool is helpful for generating news rows in your dataset. For instance, generating all the dates between a start and an end date. To exemplify, you dataset could contain three rows with a newRows column that contains 1, 2 and 3 respectively as well as an amount column that contains 300. With the Create Rows tool, you can create 0, 1 and 2 new rows respectively for rows shown in the dataset above. That would lead to the following dataset:
Note that Less automatically generates the row_number column in your dataset when you use the Create Rows tool. You can use the second input (see configuration below) to automatically disaggregate columns based on how many news rows that are being created in the dataset. By selecting to disaggregate the amount column in the dataset above, you’d get the column shown in the screenshot above - it essentially divides 300 by the number of new rows to create (i.e. 300 / 1 = 300, 300 / 2 = 150, 300 / 3 = 100).

Configuration

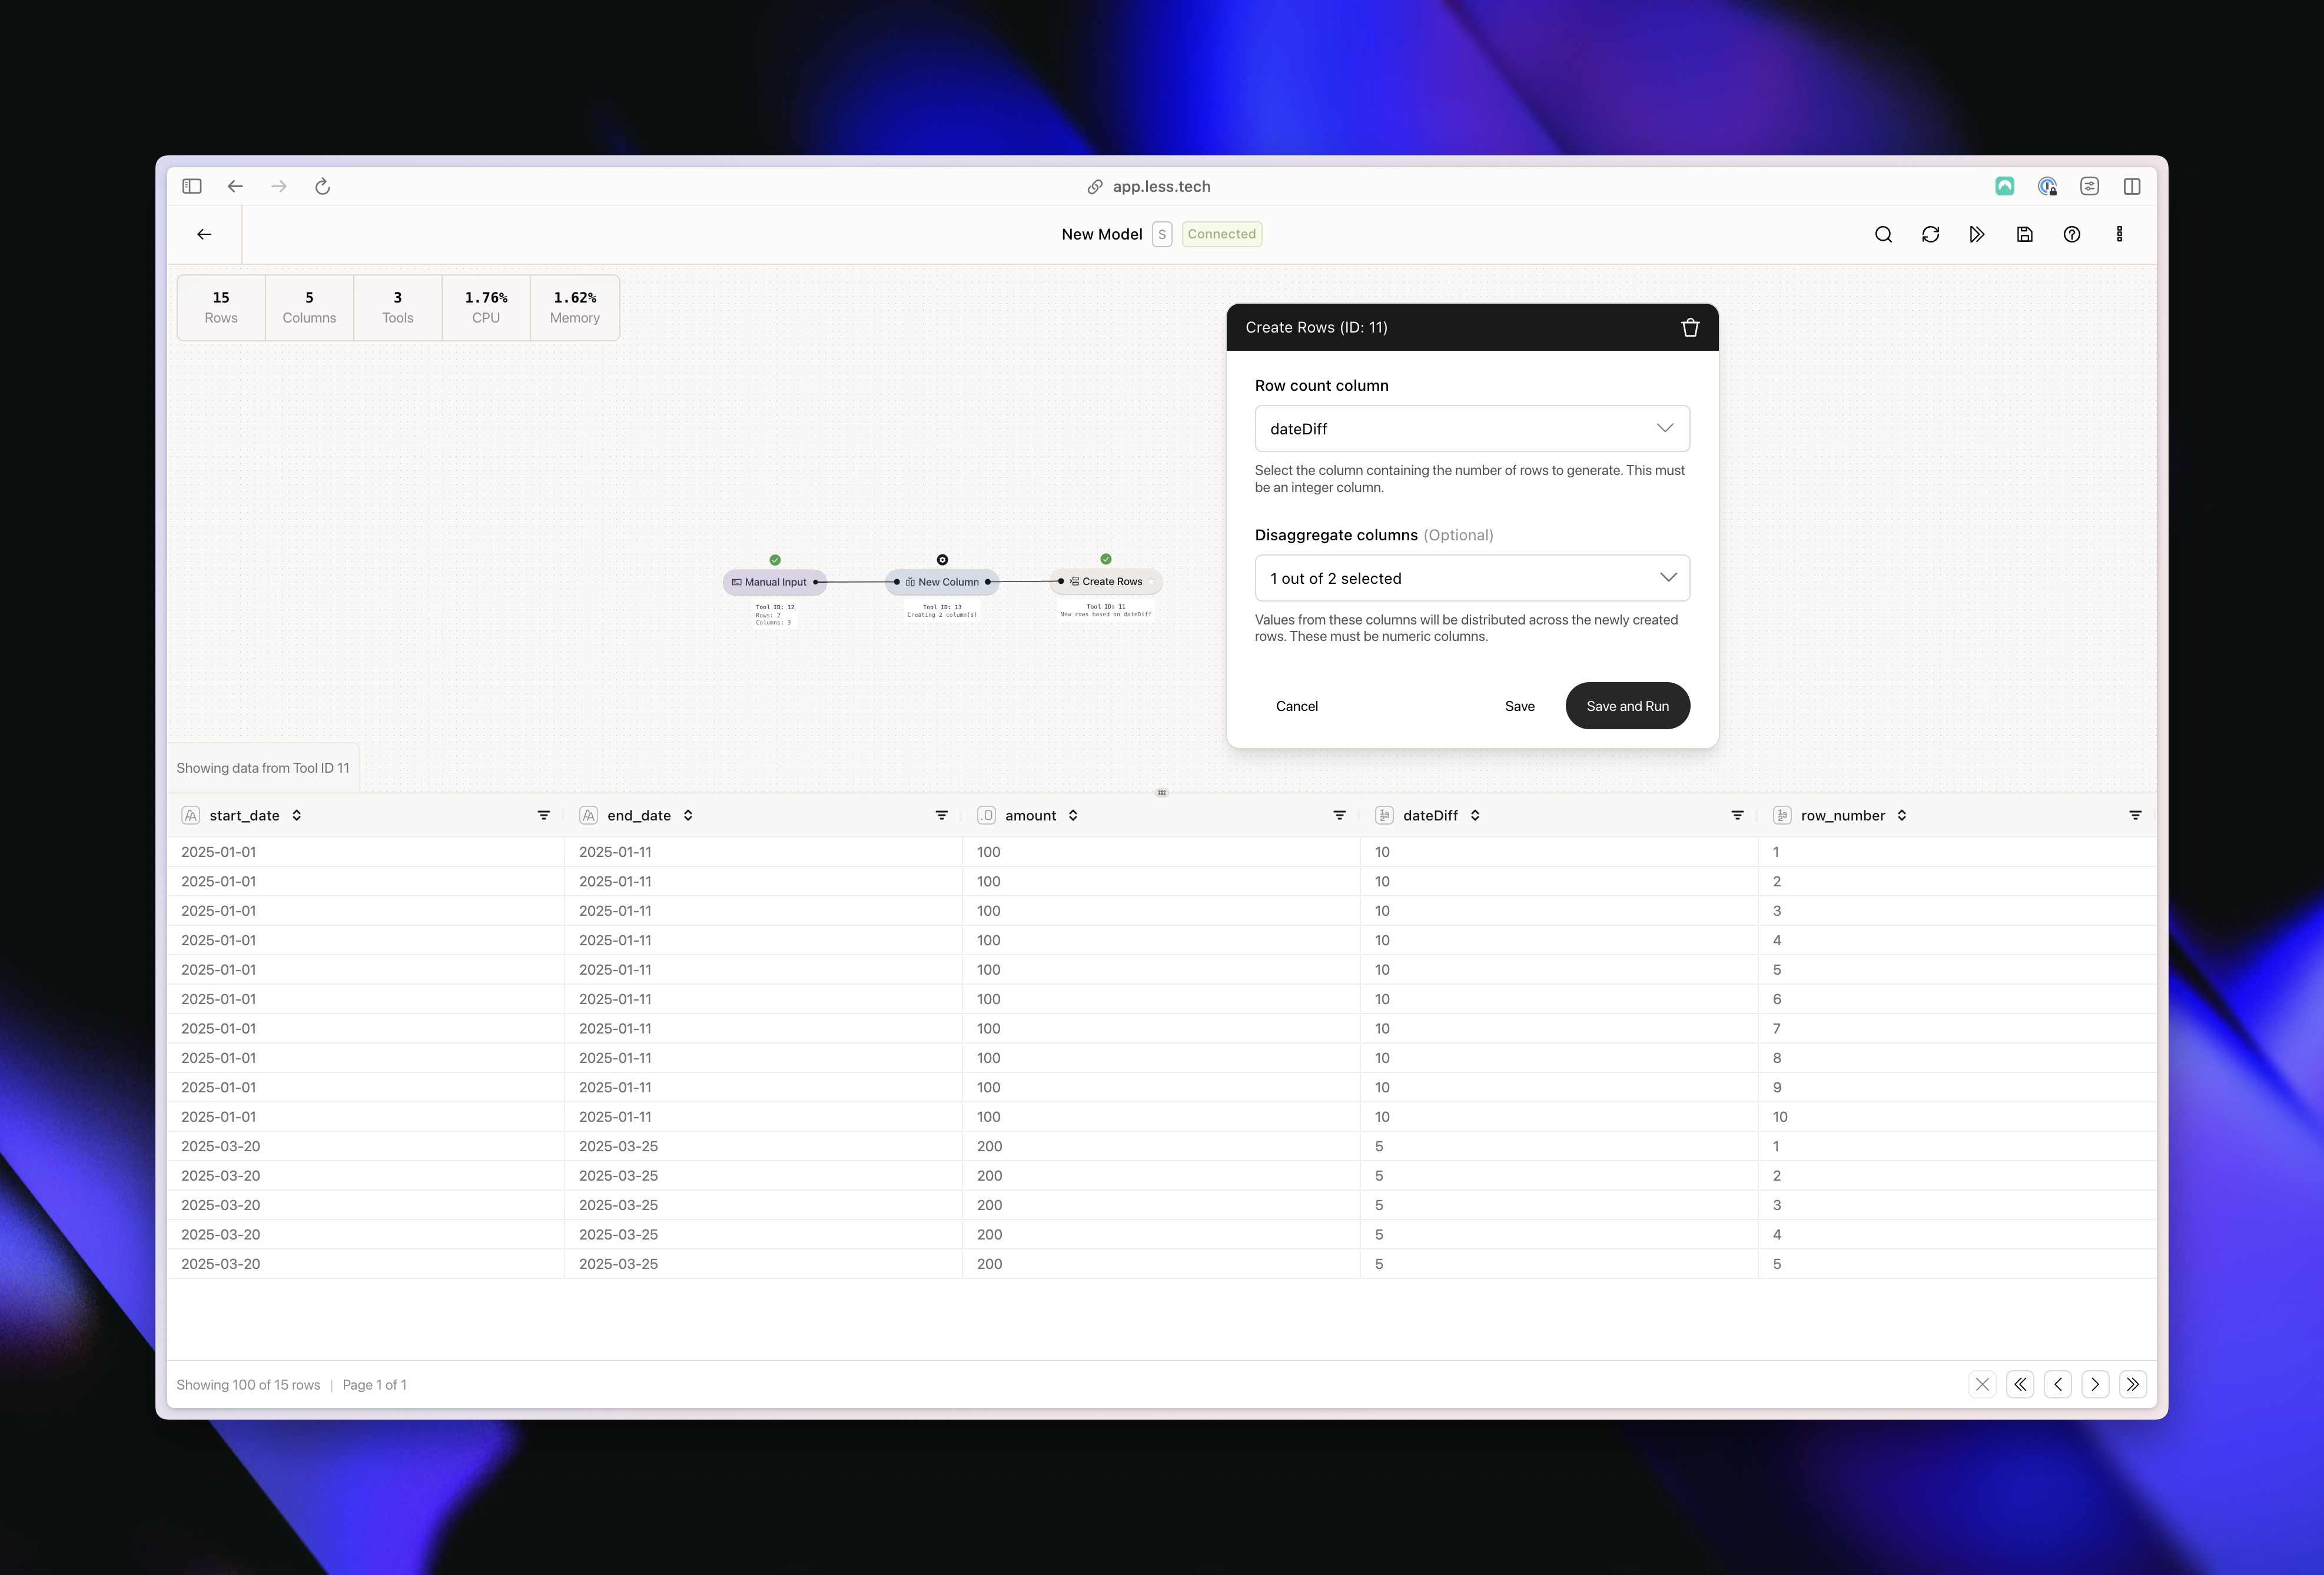
The Create Rows tool has one required input and an optional input.
1

Select column with number of rows to create

Select the column that contains an integer/whole number which represents the number of new rows you would like to create for the particular row in your dataset.The values of the column doesn’t have to be different; you can use a New Column tool to create a static number representing the number of rows you would like to create in your dataset.
2

Optional: Select column(s) to disaggregate

This is an optional step. Select the column(s) that you want to disaggregate based on the number of rows that are being created. Behind the scenes this columnn is divided by the number of rows being created.

Example

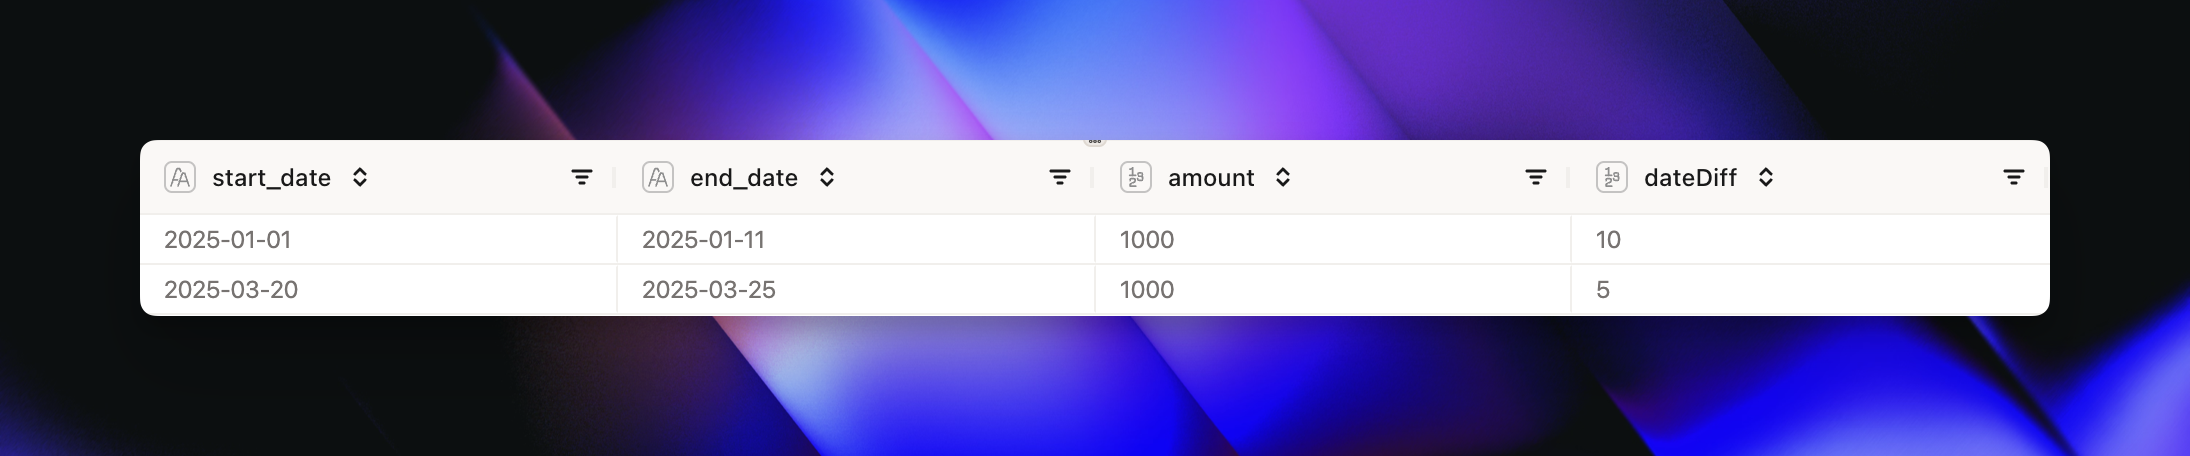
Imagine we have a dataset that looks like this:
We have calculated the difference in days between a start and an end date. We want to create a new row for each day between the start and end date. We also want to disaggregate the amount column by the number of days between the start and end date.
We use the dateDiff column to generate the number of new rows to create. We then use the amount column to disaggregate the amount by the number of days between the start and end date. We end up with 15 rows - 10 for the first original row and 5 for the second original row. The amount column has been divided by 10 in the first case and by 5 in the second case.