Configuration
Input offset
Input where you want your calculation to begin. Think of this as the row from your current row that your calculation should being. If you input -1 your calculation will always be calculated from your current row - 1 (understood vertically in your dataset).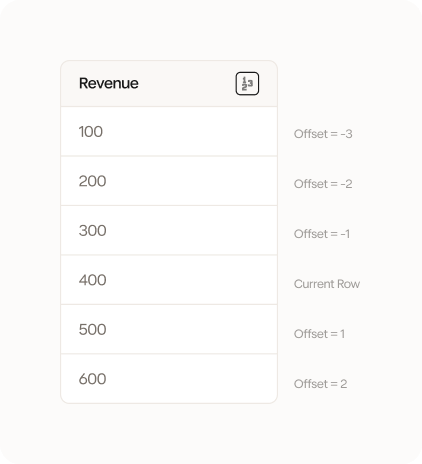
Rows to include
Input how many rows you want to lookahead (or down in your dataset) from your offset. You can understand this and the previous input as creating a rolling range of data that you consider relevant.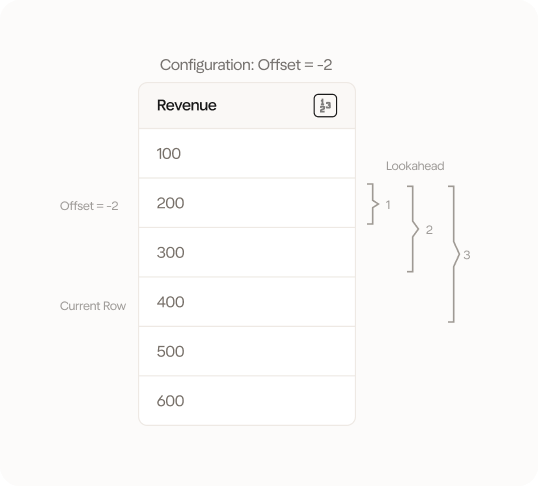
Aggregation function
Select how you want to aggregate the range that you have created with your offset and lookahead input. You can choose between sum, average, min, max, count, median and variance.
Example: Simple running sum
Here we have a very simple example where we want to calculate the running sum of our simple_int column. We want to go back 2 rows and look ahead 3 rows. We use the following configuration: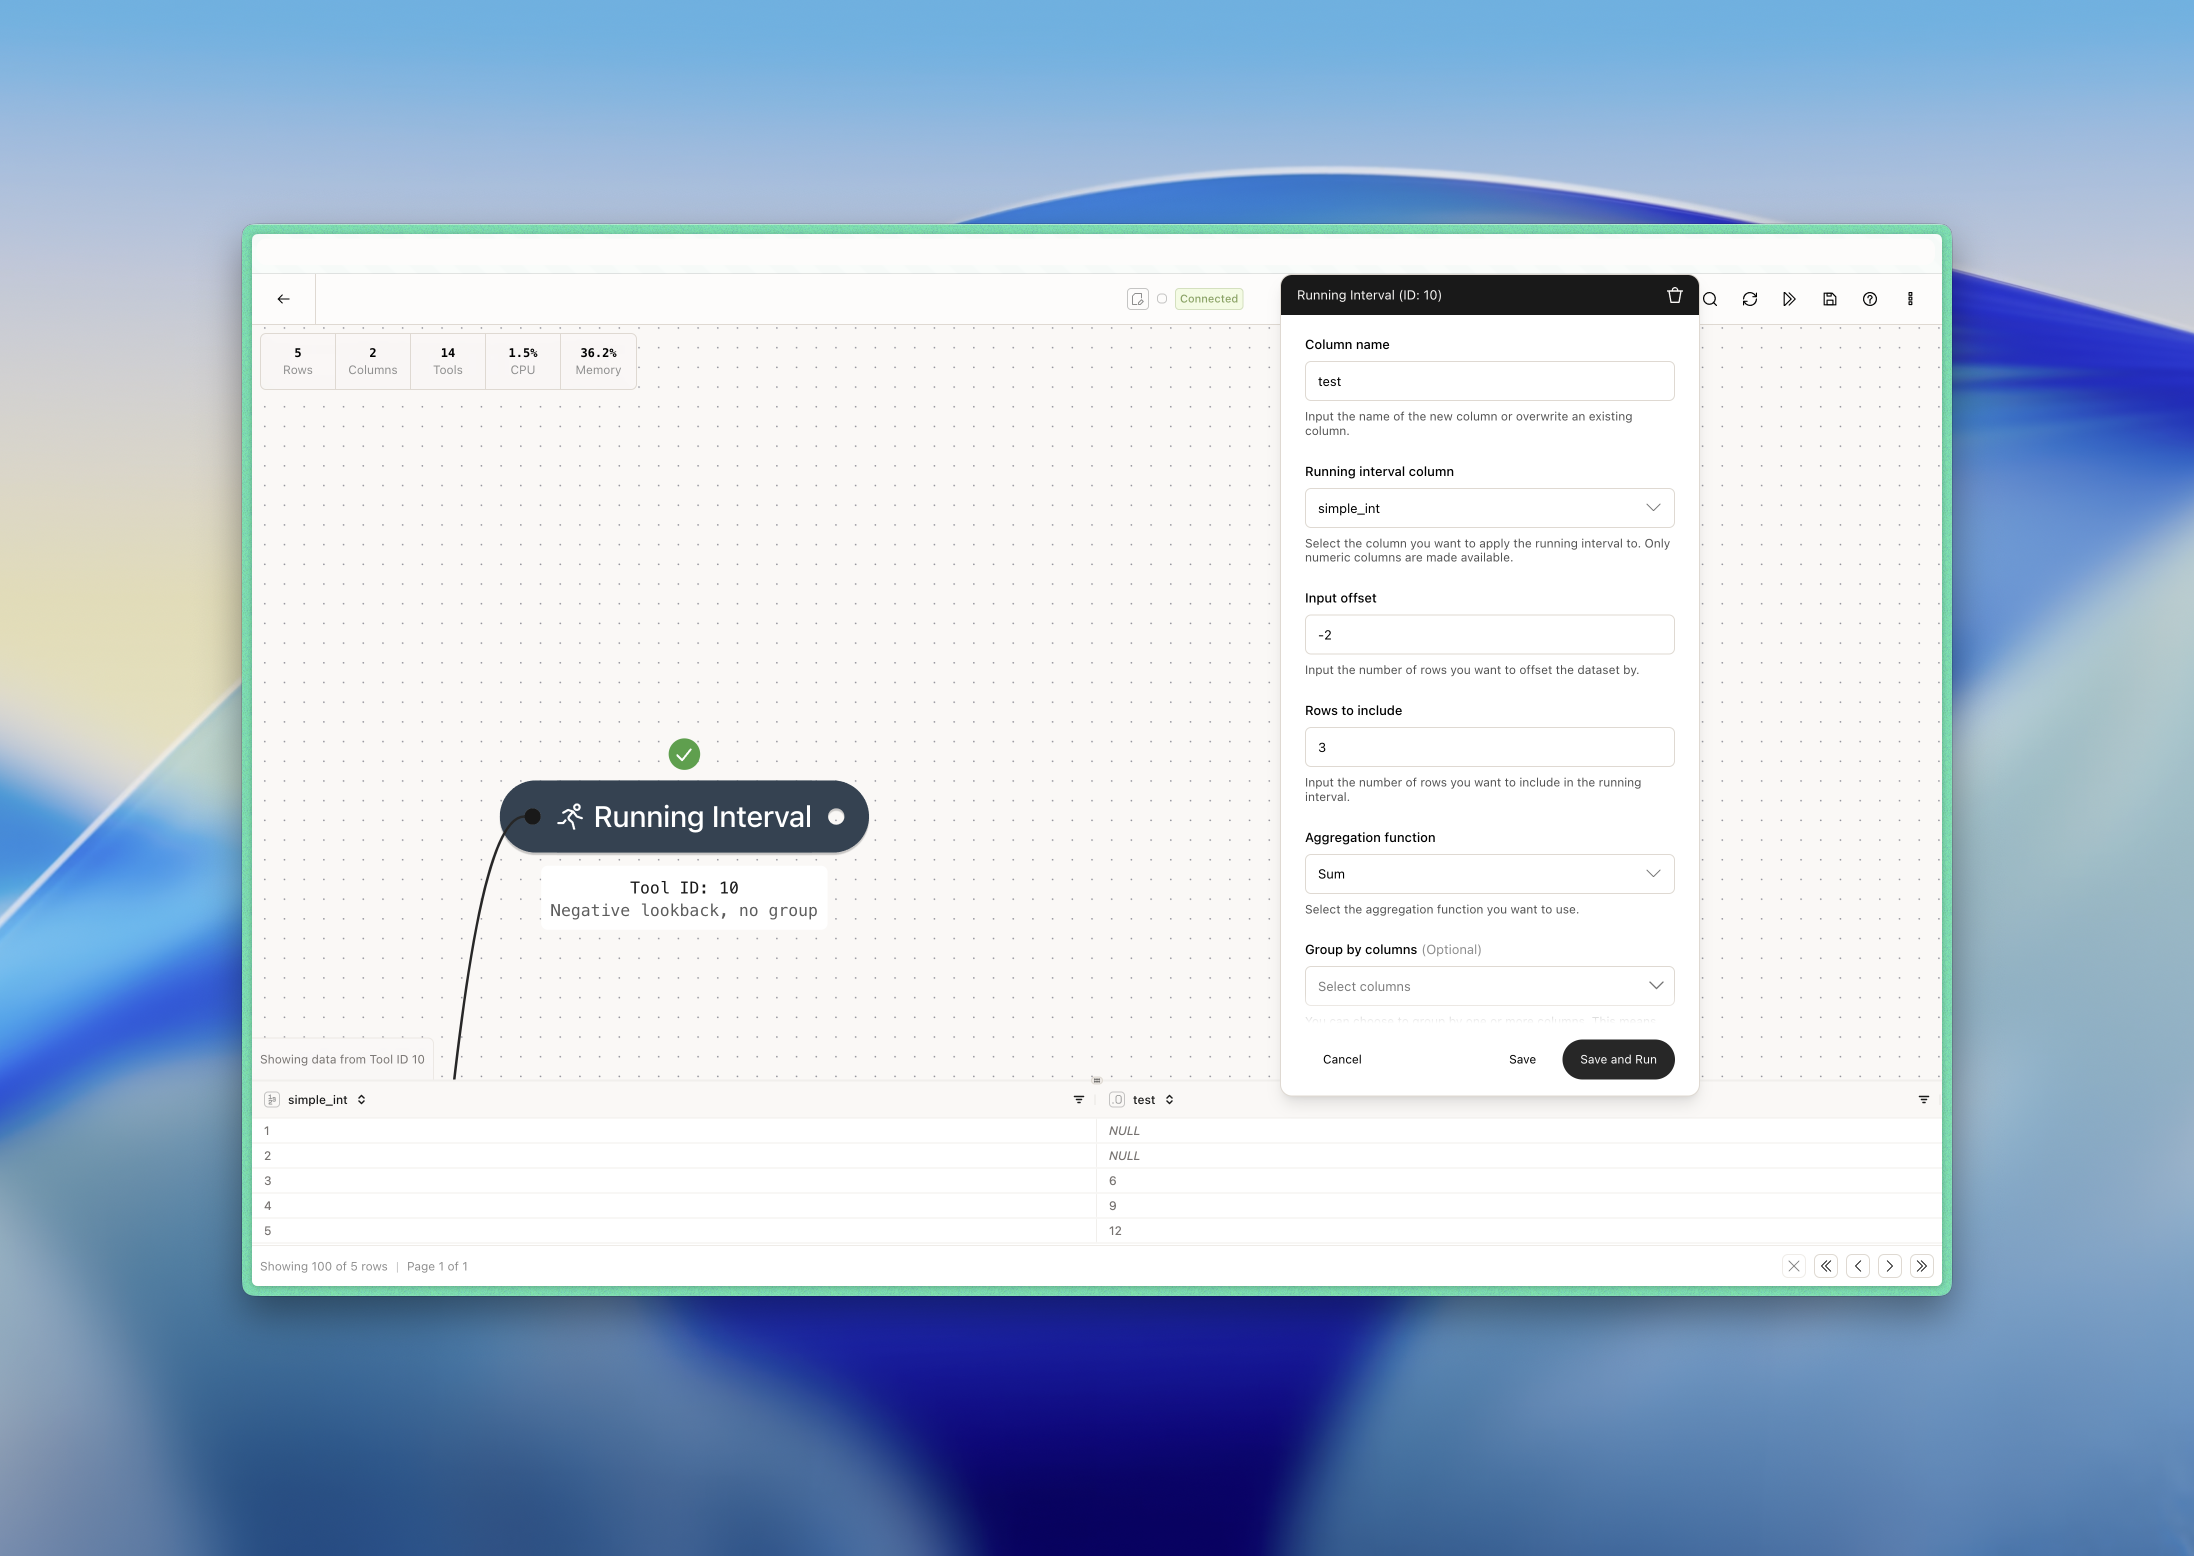
- Row 3: 1+2+3 = 6
- Row 4: 2+3+4 = 9
- Row 5: 3+4+5 = 12
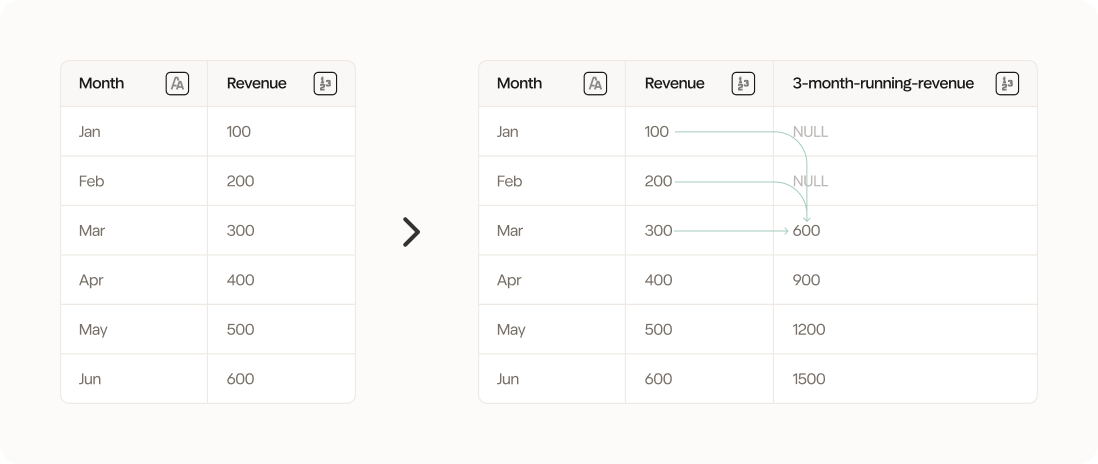
Example: 3-month rolling average revenue
In this example, we want to calculate the 3-month rolling average of revenue to get a more even revenue trend and remove the worst seasonality. We want the previous, the current and the next months to be included in the calculation. In addition, we want to group by segment which in this case is a region (EU vs. US). We use the following configuration: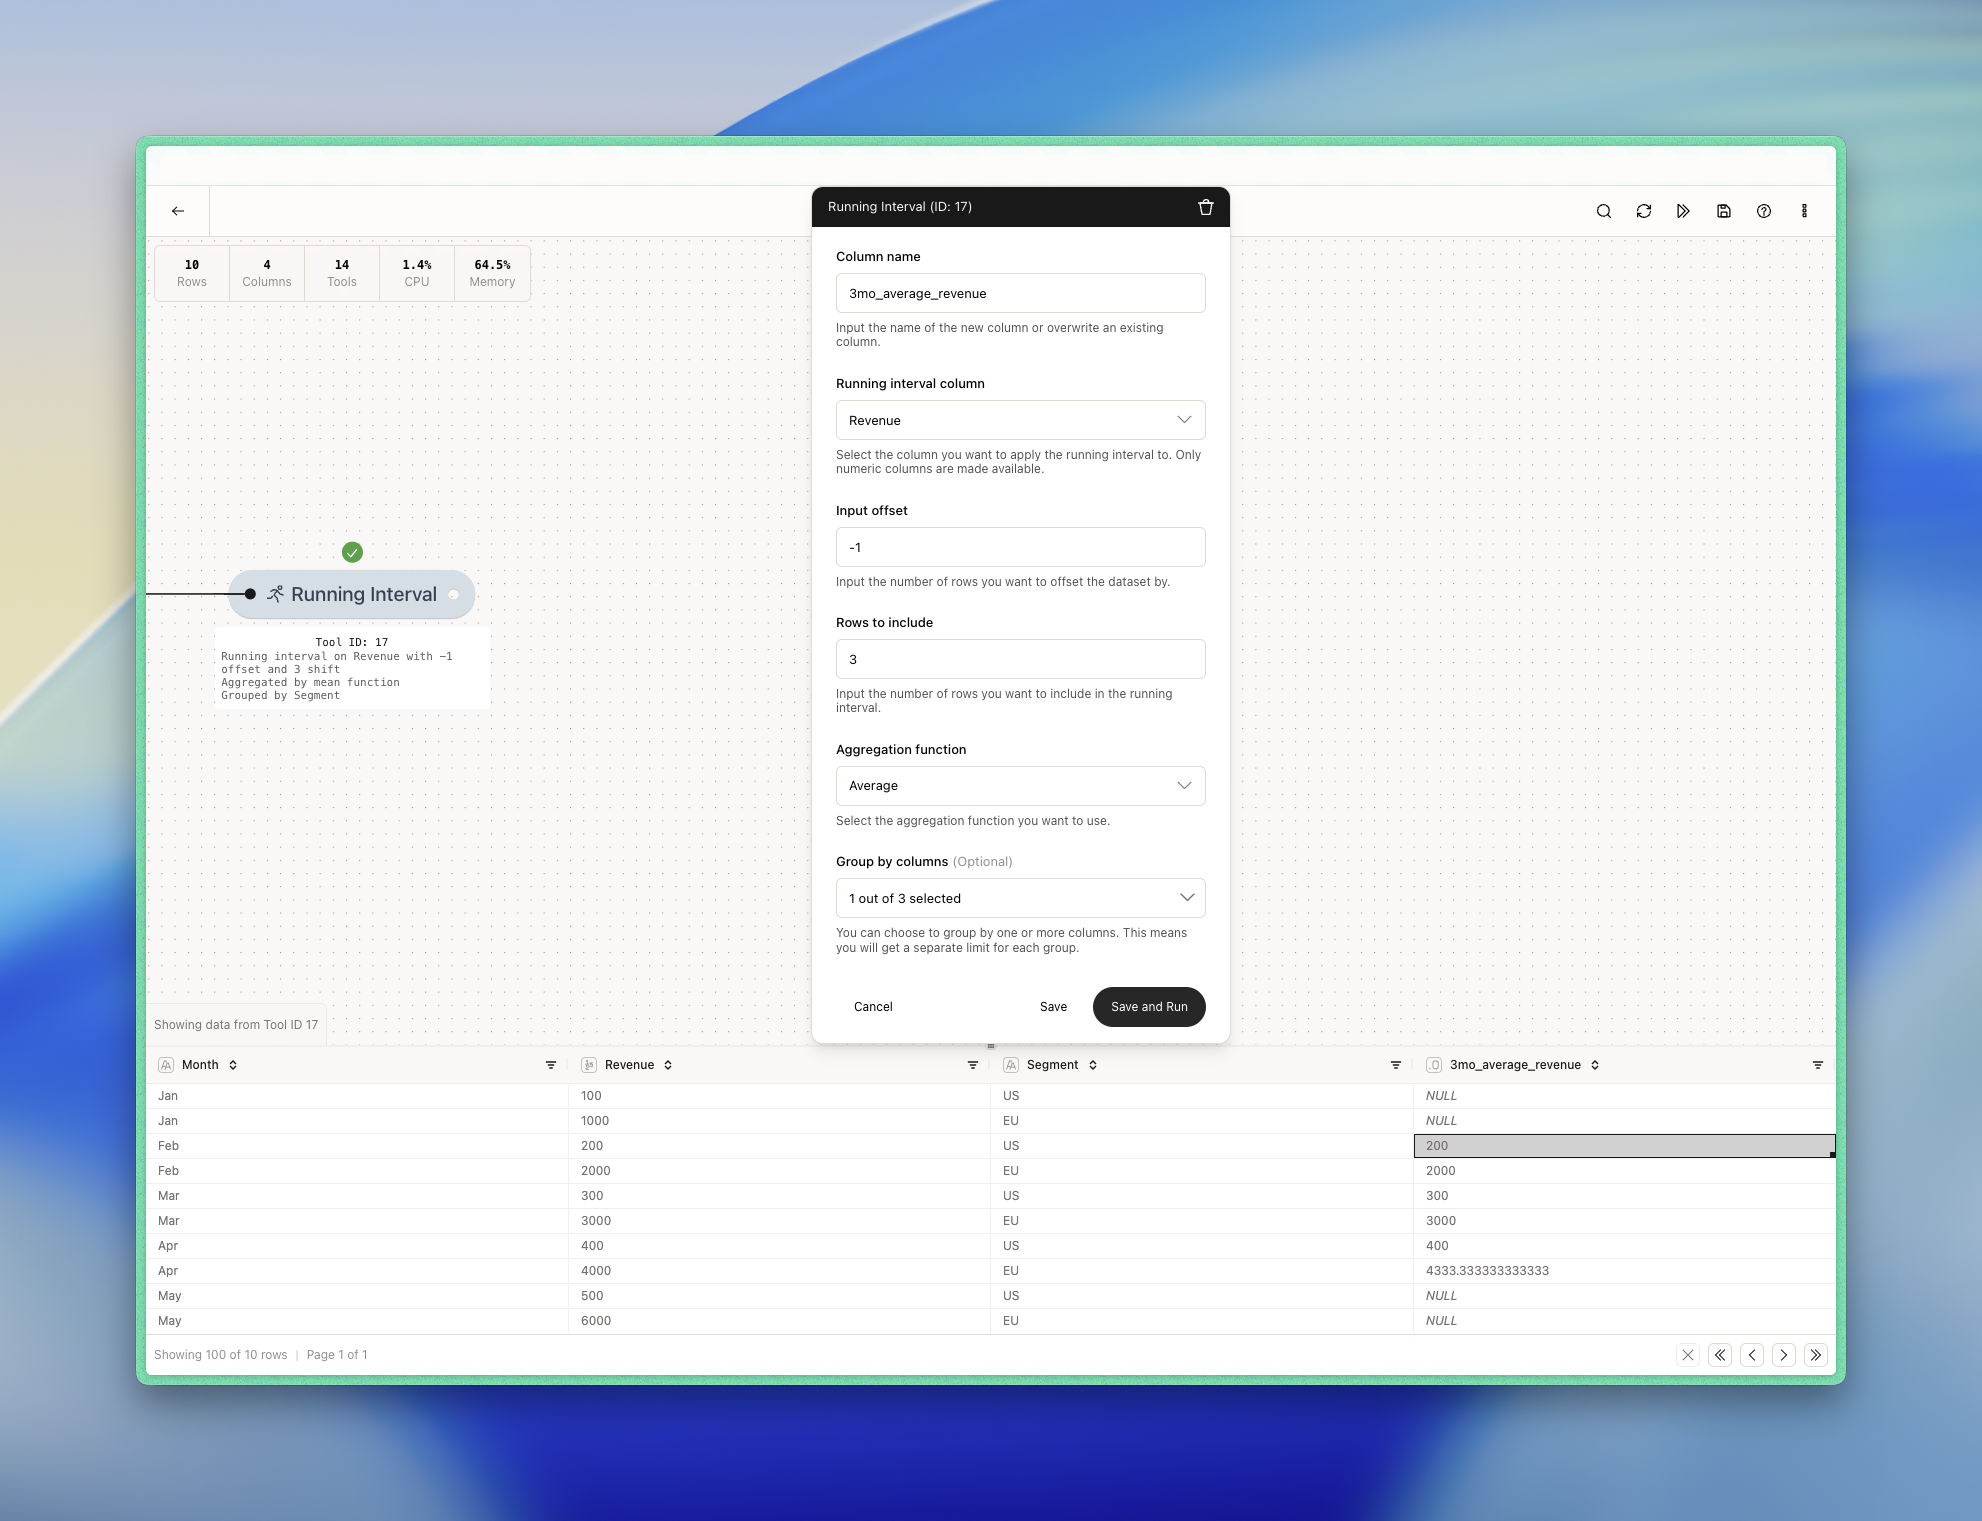
- Exclude row 2 because it’s the current month and because it’s the same region (US).
- So we jump one additional row up until we find an observation within the same group. We include row 1 because it’s the same region (US) and it then becomes our previous row/month.
- We include row 3 because it’s the current month and because it’s the same region (US).
- We skip row 4 because for the same reason as row 2.
- We include row 5 because it’s the next month and because it’s the same region (US).