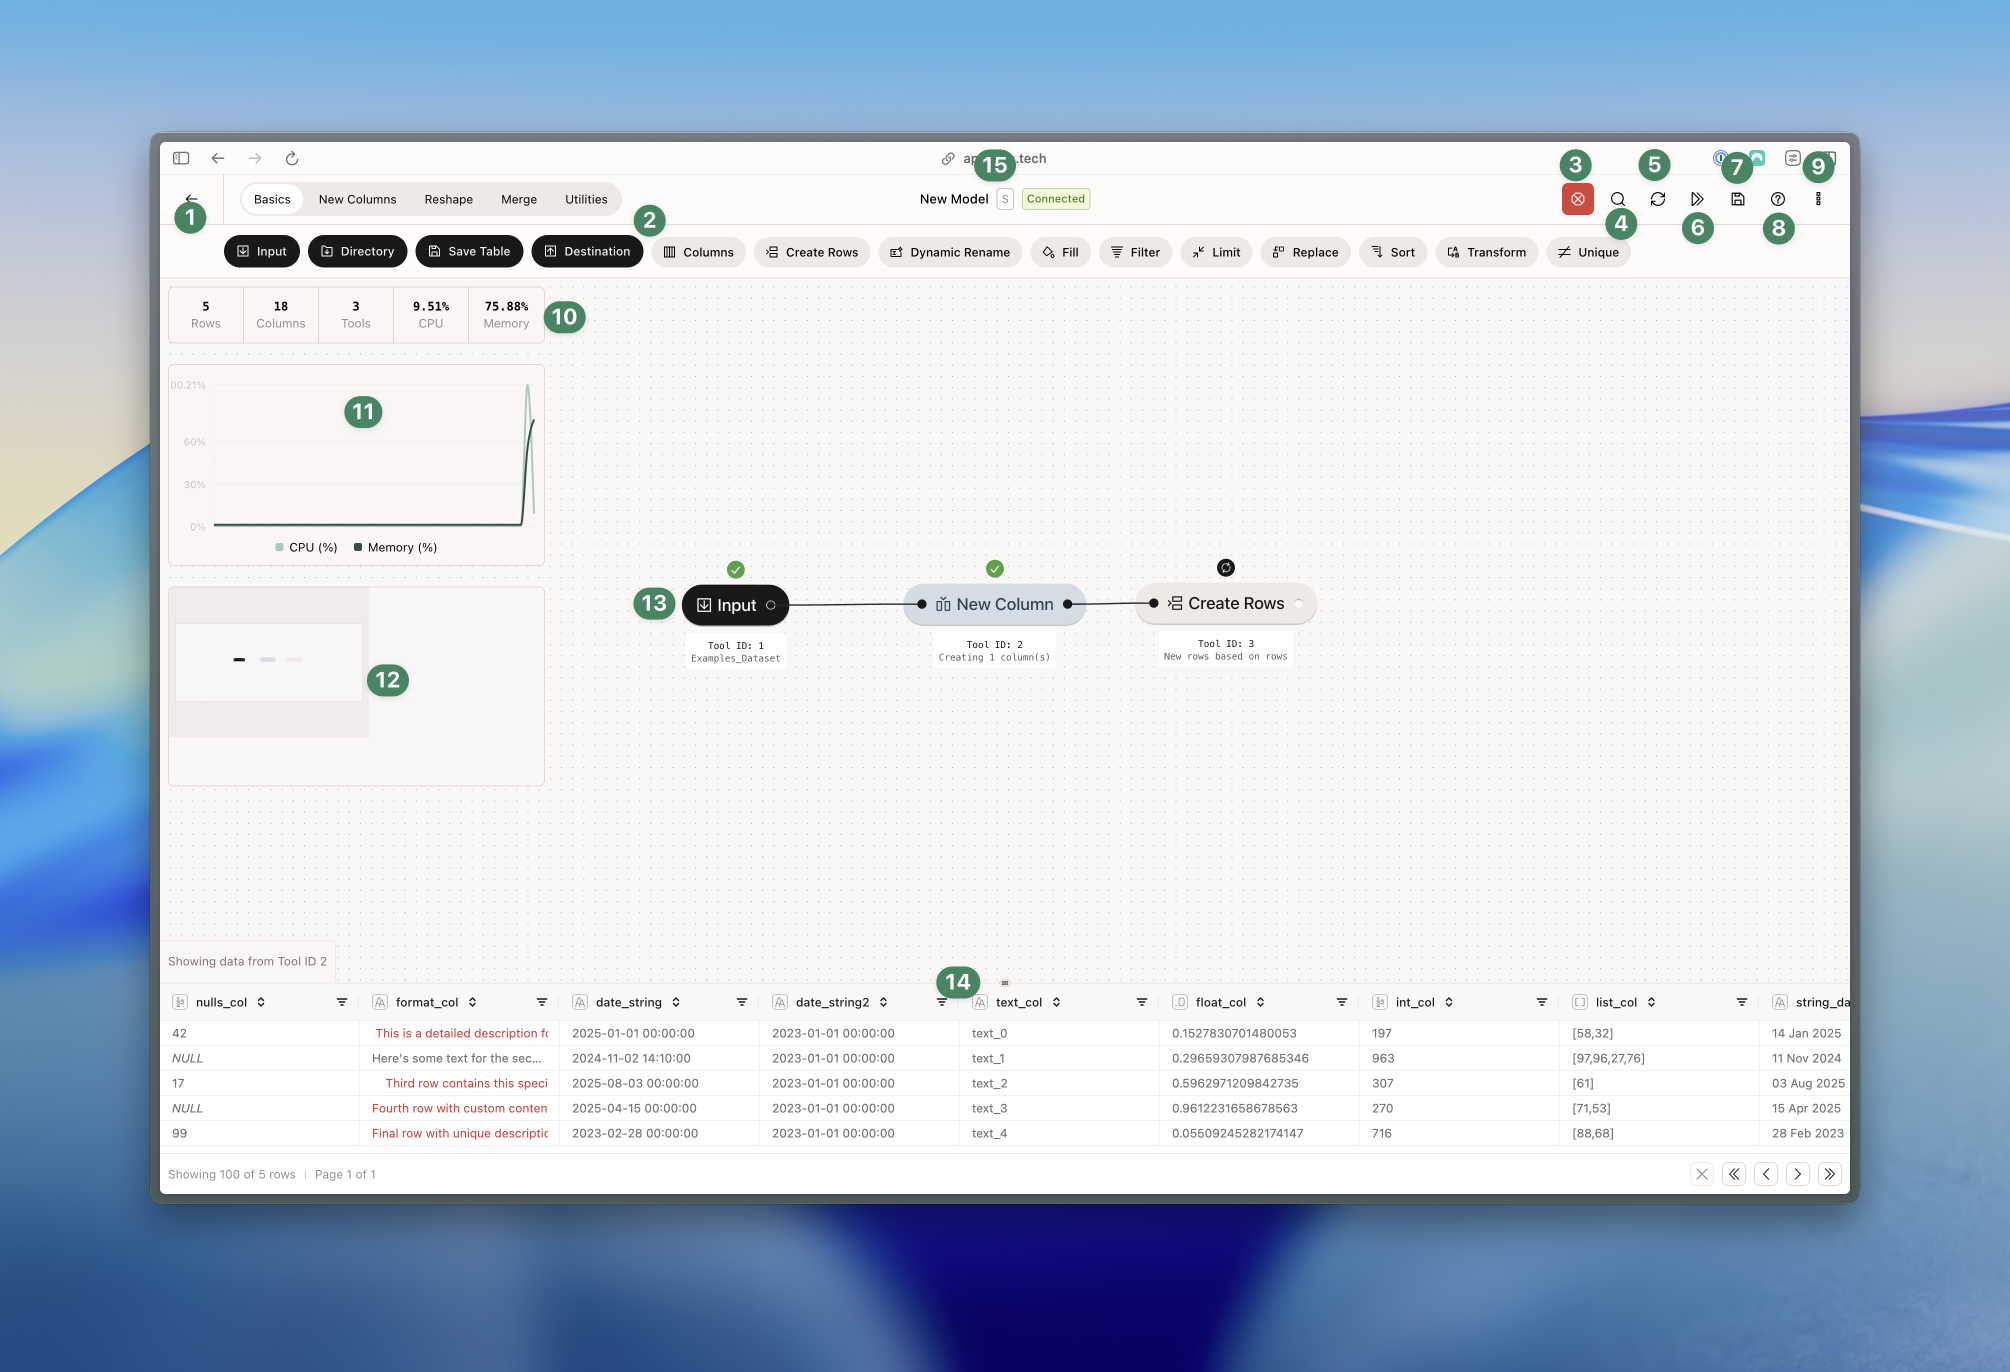
- Exit the Canvas (remember to save your work)
- This is the toolbar. You can switch between the different tabs (Basics, New Columns, etc.) in the top and drag tools from the bottom to the Canvas.
- When a process is running, you can stop it by clicking the stop button.
- Use this to search for tools. You can search by name and tool ID.
- Here you can clear your cache. This is useful if you’re experiencing performance issues or if you want to start fresh.
- This runs all your tools.
- Use this to save your model. You can also used CMD/CTRL+SHIFT+S to save your model. Read more about saving your model here.
- Click this to open the chat support.
- Additional option - read more below.
- Here we have our model metrics. You can see the number of rows, columns and tools. You also see the current CPU and Memory utilization - these are updated every 2nd second. Read more about CPU, Memory and instances here.
- This is the metrics chart. It tracks CPU and memory usage in real-time and updates every 2nd second.
- This is a minimap of the Canvas. It shows your current view and you can drag it around to change your view.
- This is a tool. On top, you see the tool status (running, stopped, etc.). When you get closer to it, it switches to a setting wheel - you can click this to open the tool configuration. If you click on a tool, you run that particular tool. Below, you see the tool ID and annotations. You can edit the annotation by clicking on it (see more about documentation here).
- Here we have the data showing you the data you’re working with. Learn more about the data grid here.
Additional options
By clicking the three dots in the top right corner, you can access additional options.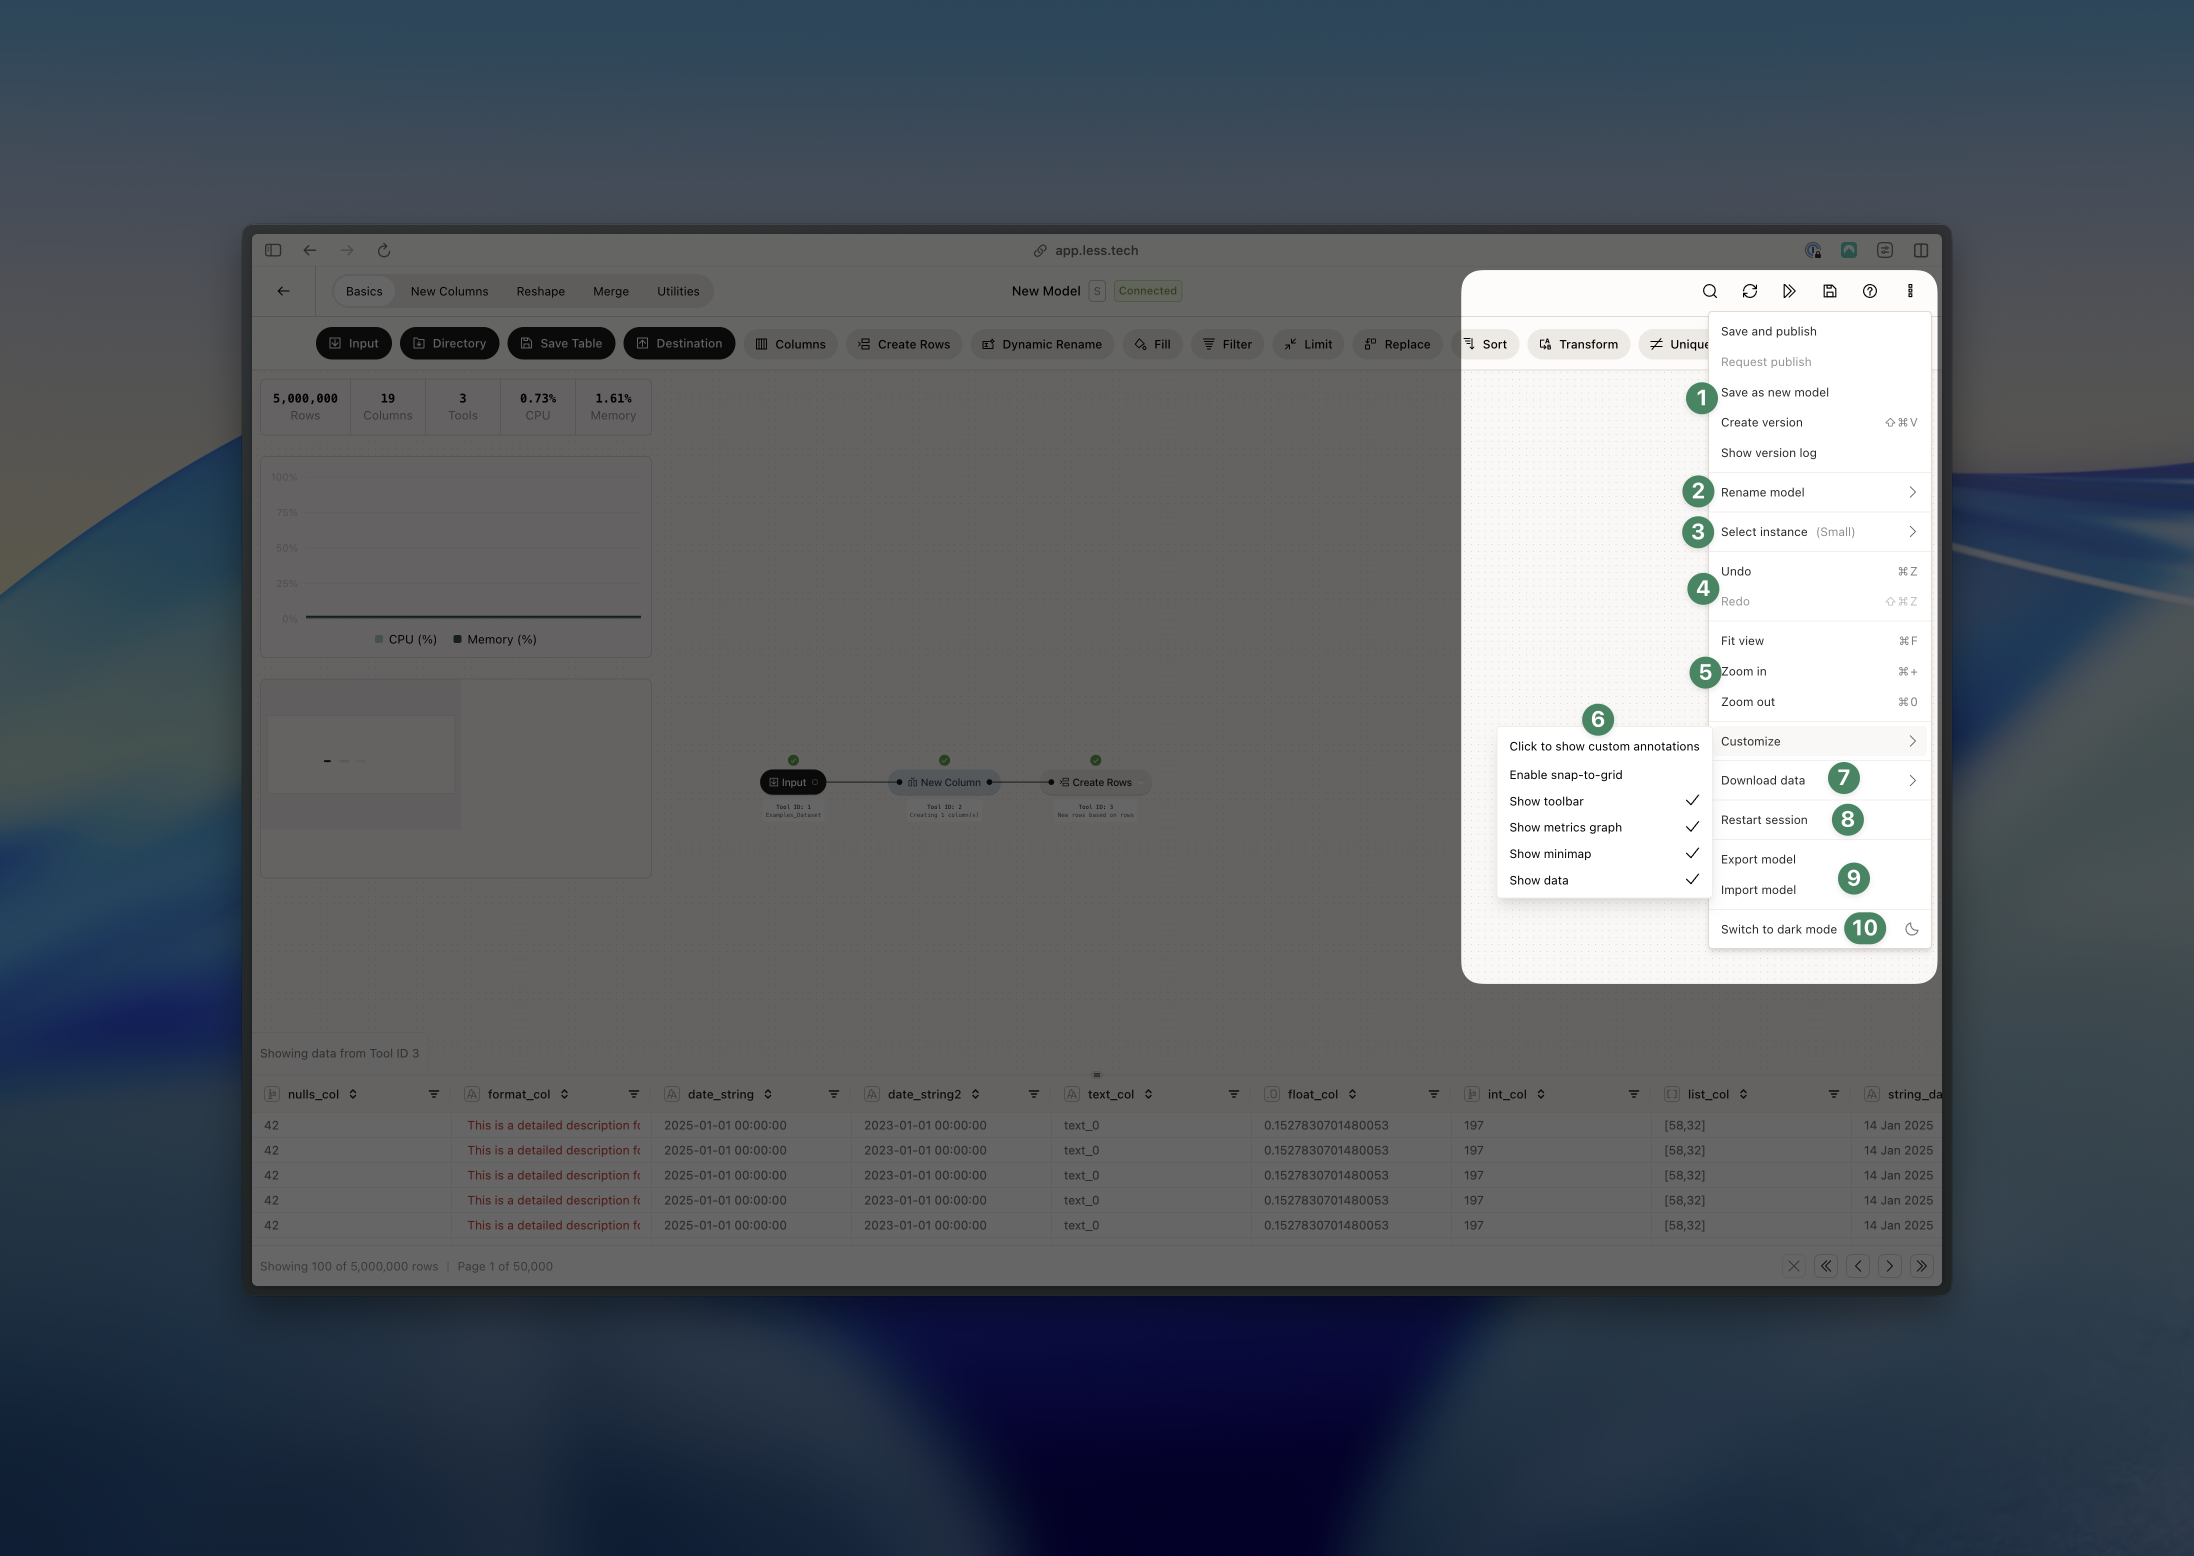
- The first five options are related to version, saving, and draft/publish. Read more about that here here.
- Here you can rename your model.
- Change you instance size - read more about instances here.
- Use this to undo / redo your changes. You can also use CMD/CTRL+Z and CMD/CTRL+Y to undo / redo your changes.
- Here you can fit your view to your tools - you can also use CMD/CTRL+F. You can also zoom in and out (also using CMD/CTRL++ and CMD/CTRL+0).
- Customize your Canvas: you can show all/custom/no annotations, enable/disabled snap-to-grid, show/hide the toolbar, show/hide the metrics chart, show/hide the minimap and show/hide the datagrid.
- Download your data as either a CSV or Excel file. File size is limited to 20.000.000 cells (rows * columns) - anything above that will fail.
- Use this to restart your session
- Here you can export your model as JSON file or import a model.
- Switch between light/dark mode.