Task
In Part 2 of this exercise, we’ll work with the output from Part 1. If you’re up for it, save the table from Part 1 as a table with the Output action and input it in a new model. The objective is to create a table identical to the one below. It showing each year as a row with a Gross Profit Margin and an Operating Profit Margin. We did it in 20 new actions. You might want to take a look at the Transpose and Compare action.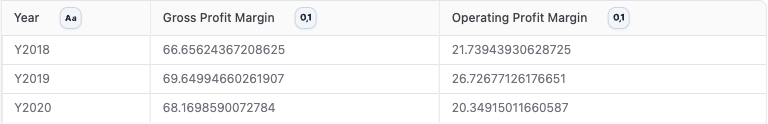
Metric Definitions
These are the definitions for the metrics you will create.- Gross Profit Margin: ((sales - cost of sales)/sales)*100
- Operating Profit Margin: (EBIT/sales)*100
Hints
Hint #1
Hint #1
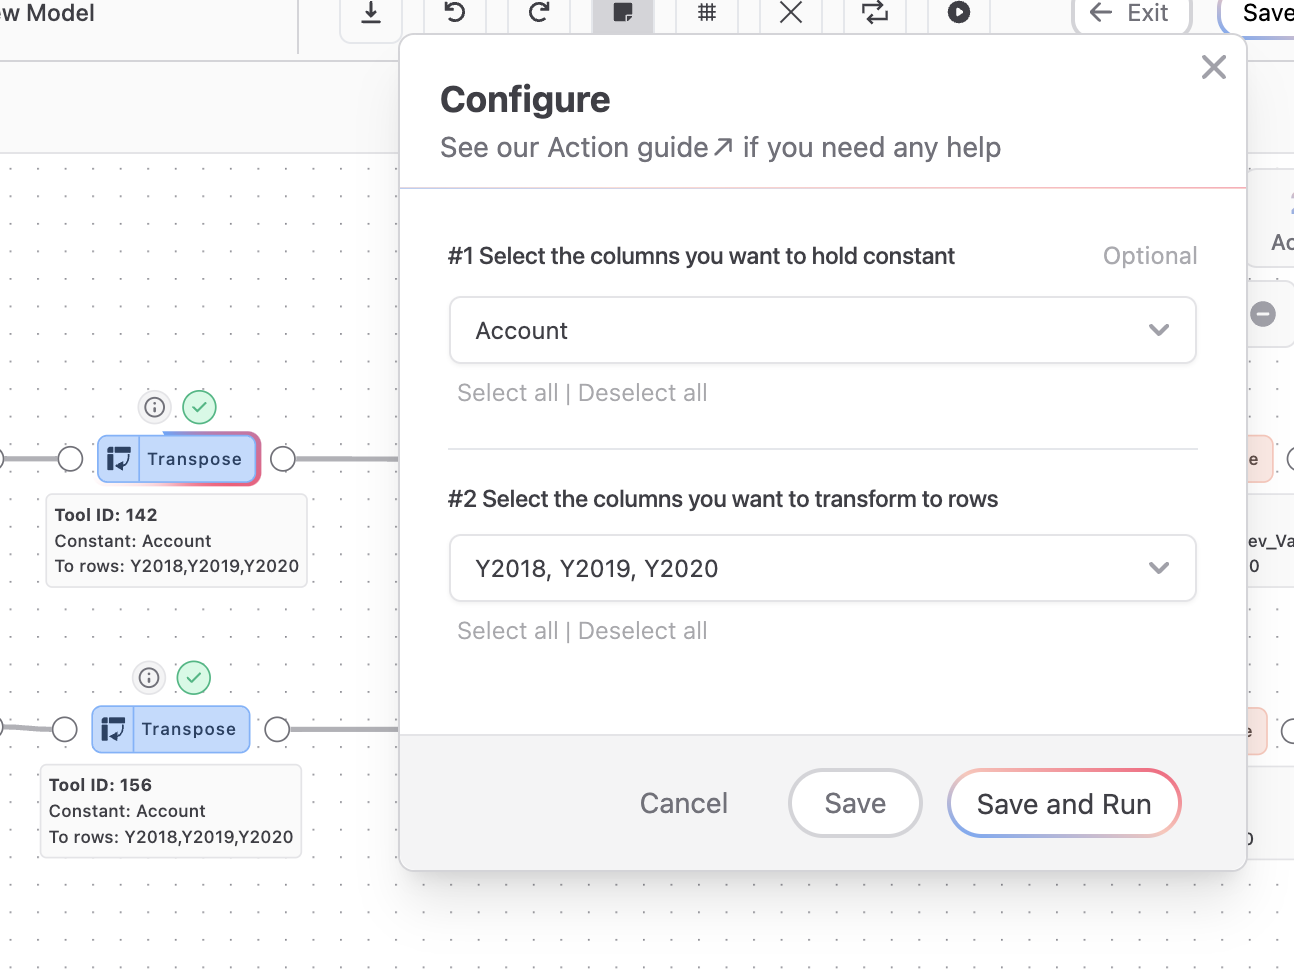
In the first section of solving this part, we going to split up the output from Part 1 (use an Output tool at the end of Part one above) into two streams - one for the Gross Profit Margin (GPM, top) and one for the Operating Profit Margin (OPM, bottom).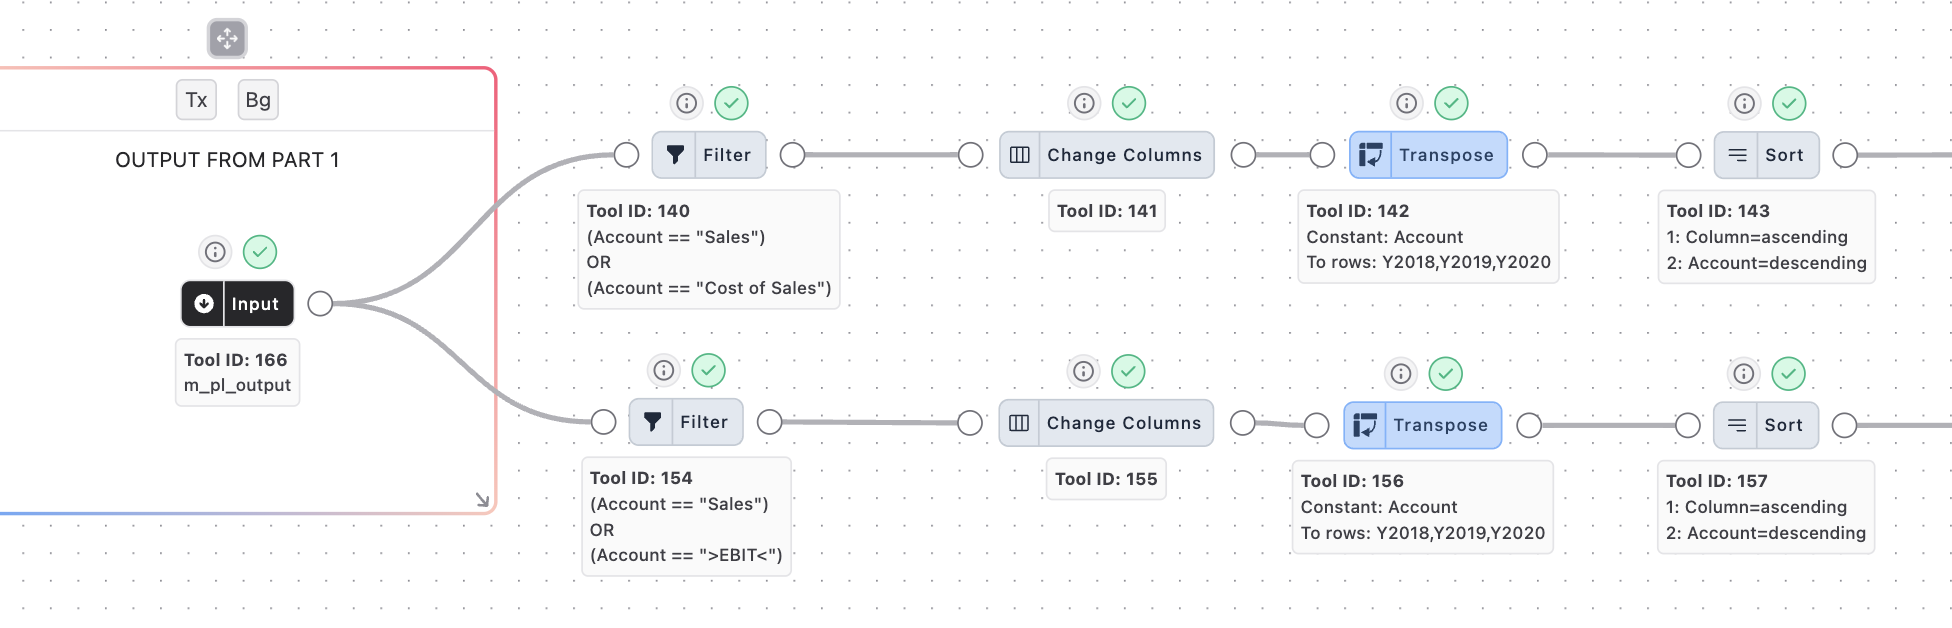
Hint #2
Hint #2
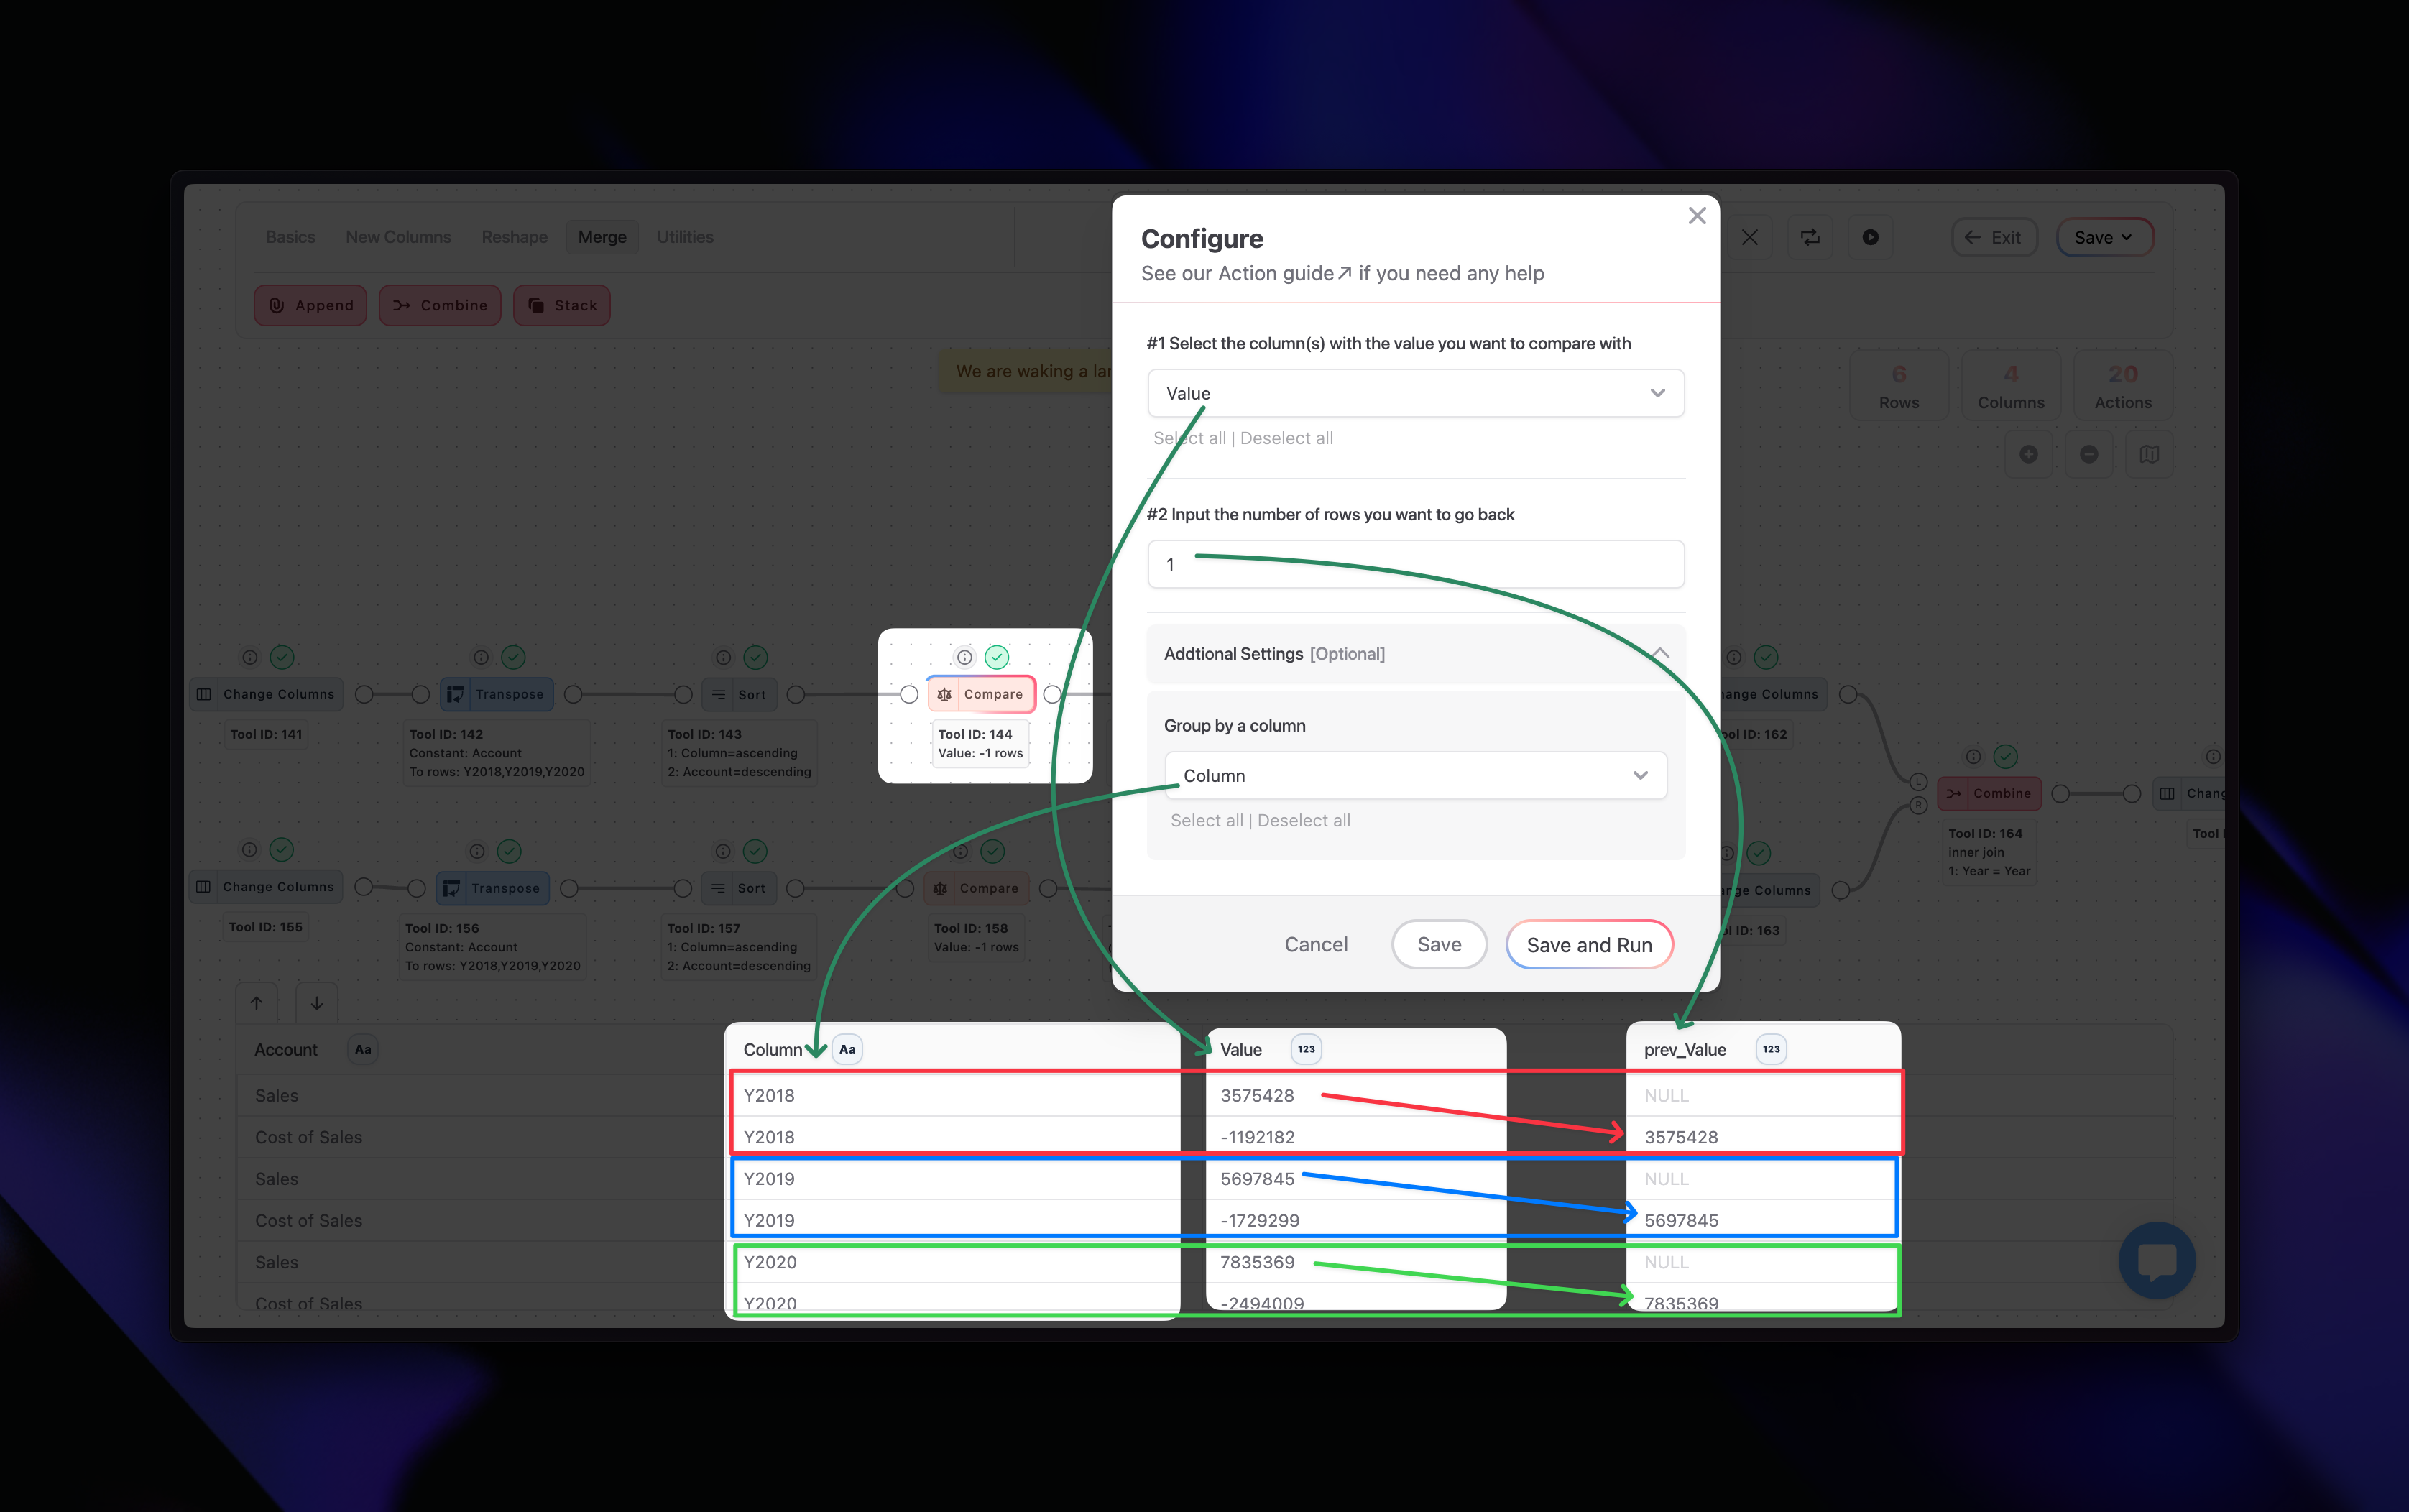
The second section of this part is about calculating our metrics. We do that with a Compare tool and a Calculate. The Compare tool is what really helps us achieve what we want. The entire second section looks like this: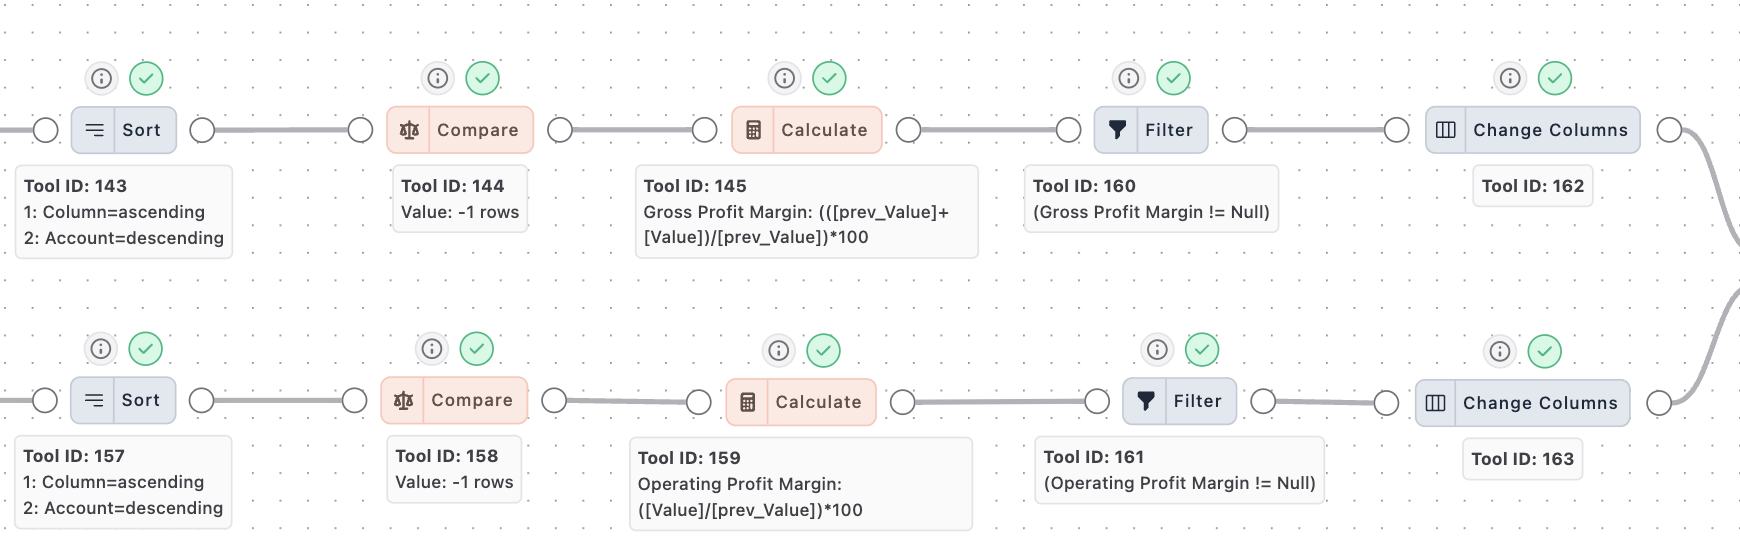
Hint #3
Hint #3
The final step we simply use a Combine tool to merge the two streams of data back together. We Combine using an Inner Join on the Year column. It looks like this: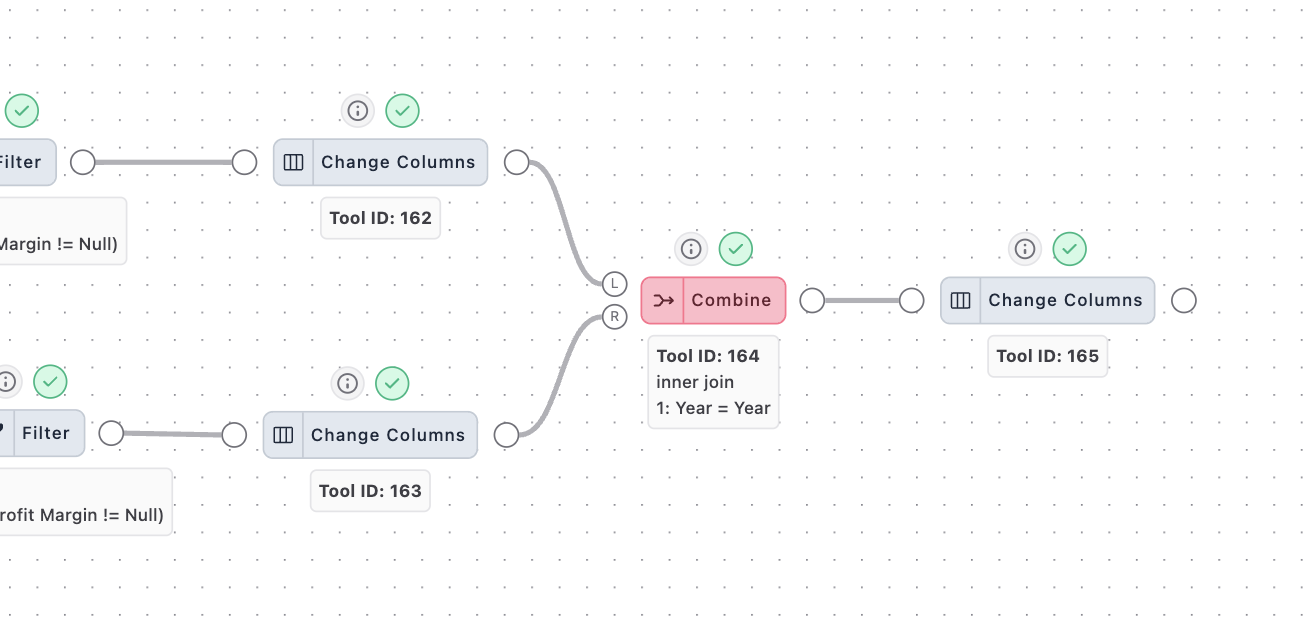
Solution File
Download the solution file for the task here. See how to import it below. Remember to import it in a new model.