You’ll learn tool such as Combine, Date Format, Group By and Calculate
Context
You’ll be pretending to be an analyst in the marketing team. You want to understand how your paid marketing performance in relation your orders. The data you’ll be working with is mirroring real-life data from Shopify, Google Ads and Facebook Ads. Our solution model is built with 33 tools.Data
Create a new connection. Search for “exercise” and select the Data-Driven Ecommerce. Configure the connector and you should have access to the tables from the Canvas.Task
The goals is to get the results shown below. It contains 9 rows - one for each month from Apr 2023 to Dec 2023 (inclusive).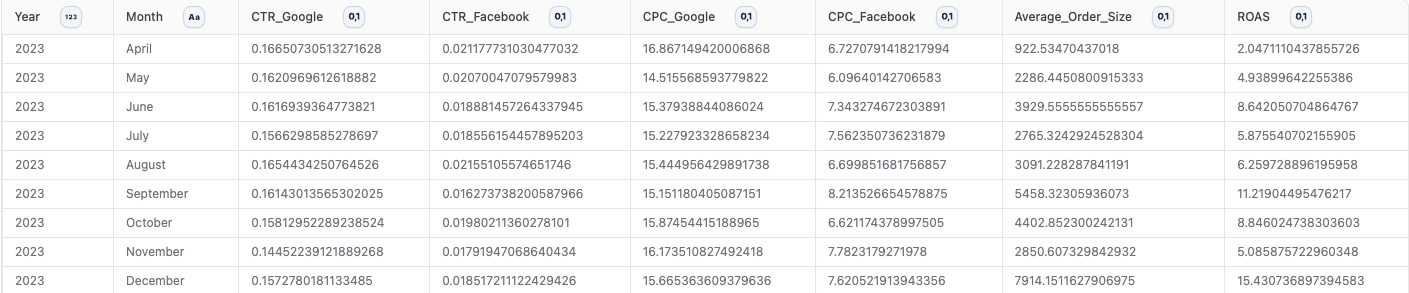
Metric Definitions
We have four metrics in the end result. CTR, CPC, Average Order Size and ROAS. We’ll define each below:- Click-Through-Rate (CTR): clicks divided by impressions. Measures proportion of individuals that see an online advertisement (impressions) and subsequently click on it.
- Cost-Per-Click (CPC): spend divided by clicks. Measures the cost of a click on an online advertisement.
- Average Order Size: sum of order amount divided by total number of orders.
- Return-On-Ad-Spent (ROAS): revenue generated divided by advertisement cost/spent. A ratio to measured the return (revenue) from the investment (ad spent). Note that we don’t do any advanced attribution.
Part 1
For the first part of the exercise the ambition is just to get to the results below. In other words, don’t focus on the ROAS metric.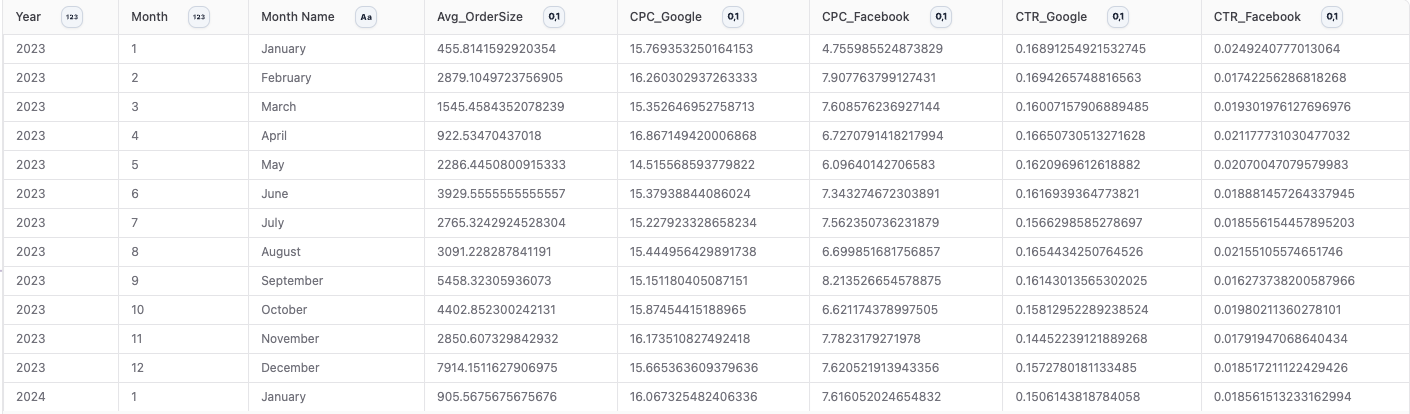
Hint #1
Hint #1
The first step is to input the data and summarize it by Year and Month. We do by first changing the date columns to a Datetime format in the Change Columns. Then, because they’re now Datetime, we use a Date Format to create two new columns for each input - Monthname and Year. Finally, we use a Group By to group our data by the newly created monthname and year columns while summarizing the metrics we’re interesting in and counting the orders from Shopify.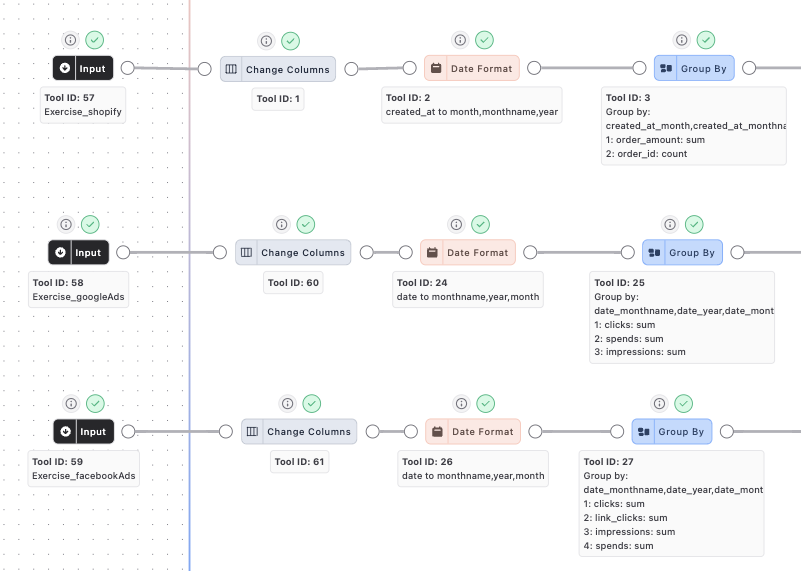
Hint #2
Hint #2
The second step is about consolidating our three datasets into a single dataset. We use two Combine tools to do that. We choose left joins every time and our ID’s are the respective Monthname and Year columns. The Combine is essentially looking in each dataset to find mathing ID and when it finds a pairs (e.g. monthname =April, year = 2022), add combines the columns into a single row.We also calculate the average order size with a Calculate tool on the Shopify data before combining.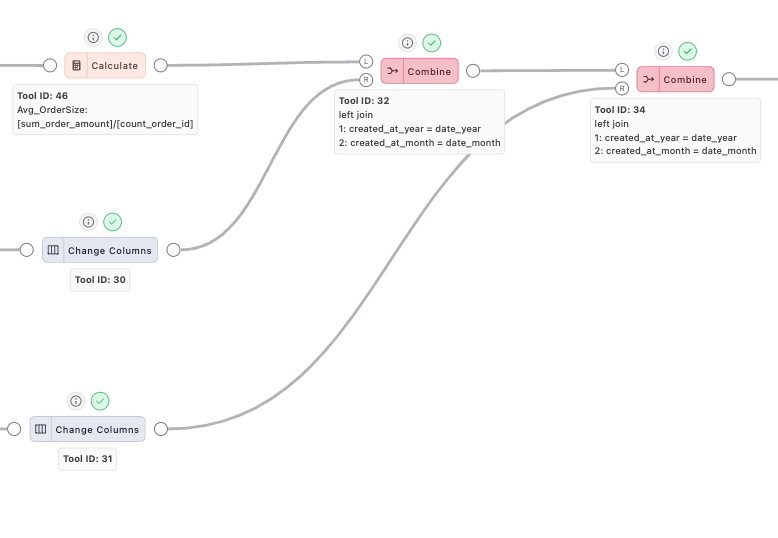
Hint #3
Hint #3
The next step of our analysis is about Cost-Per-Click (CPC) and Click-Through-Rate (CTR) for our two marketing sources. We do that with Calculate tools and according to the definitions outlined in the Metric Definition.Finally, use a Change Columns tool to remove unnecessary columns and a Sort tool to sort ascending by Year and Month.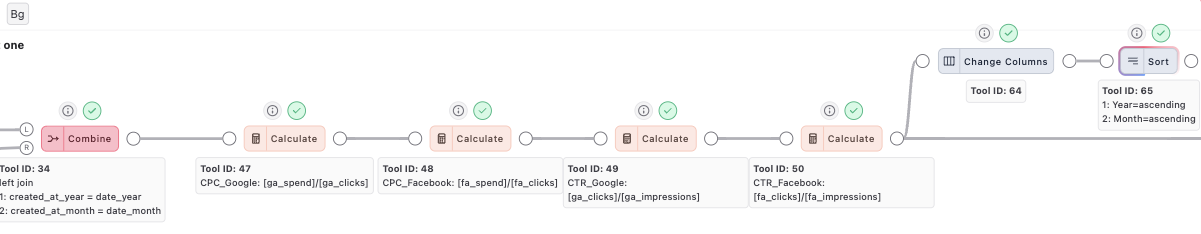
Part 2 (Difficult)
We have added some extra complexity for those who want to go the extra mile. We assume our marketing spend has a delayed affect on revenue which differs by the channel (i.e. Facebook and Google). In other words, we spend money on Google Ads to get potential customer to know us and on Facebook to get them to purchase our product on Shopify. Consequently, we imagine that our Google Ads spend have a 4 month delay on impacting our revenue (top-funnel) and Facebook have a 1 month delay (bottom-funnel). Our ROAS metric should take this into consideration. The formula looks like this: Where:- ROAS_t represents the Return on Advertising Spend at time t
- Amount_t denotes the amount earned (i.e. Spotify revenue) at time t (current month)
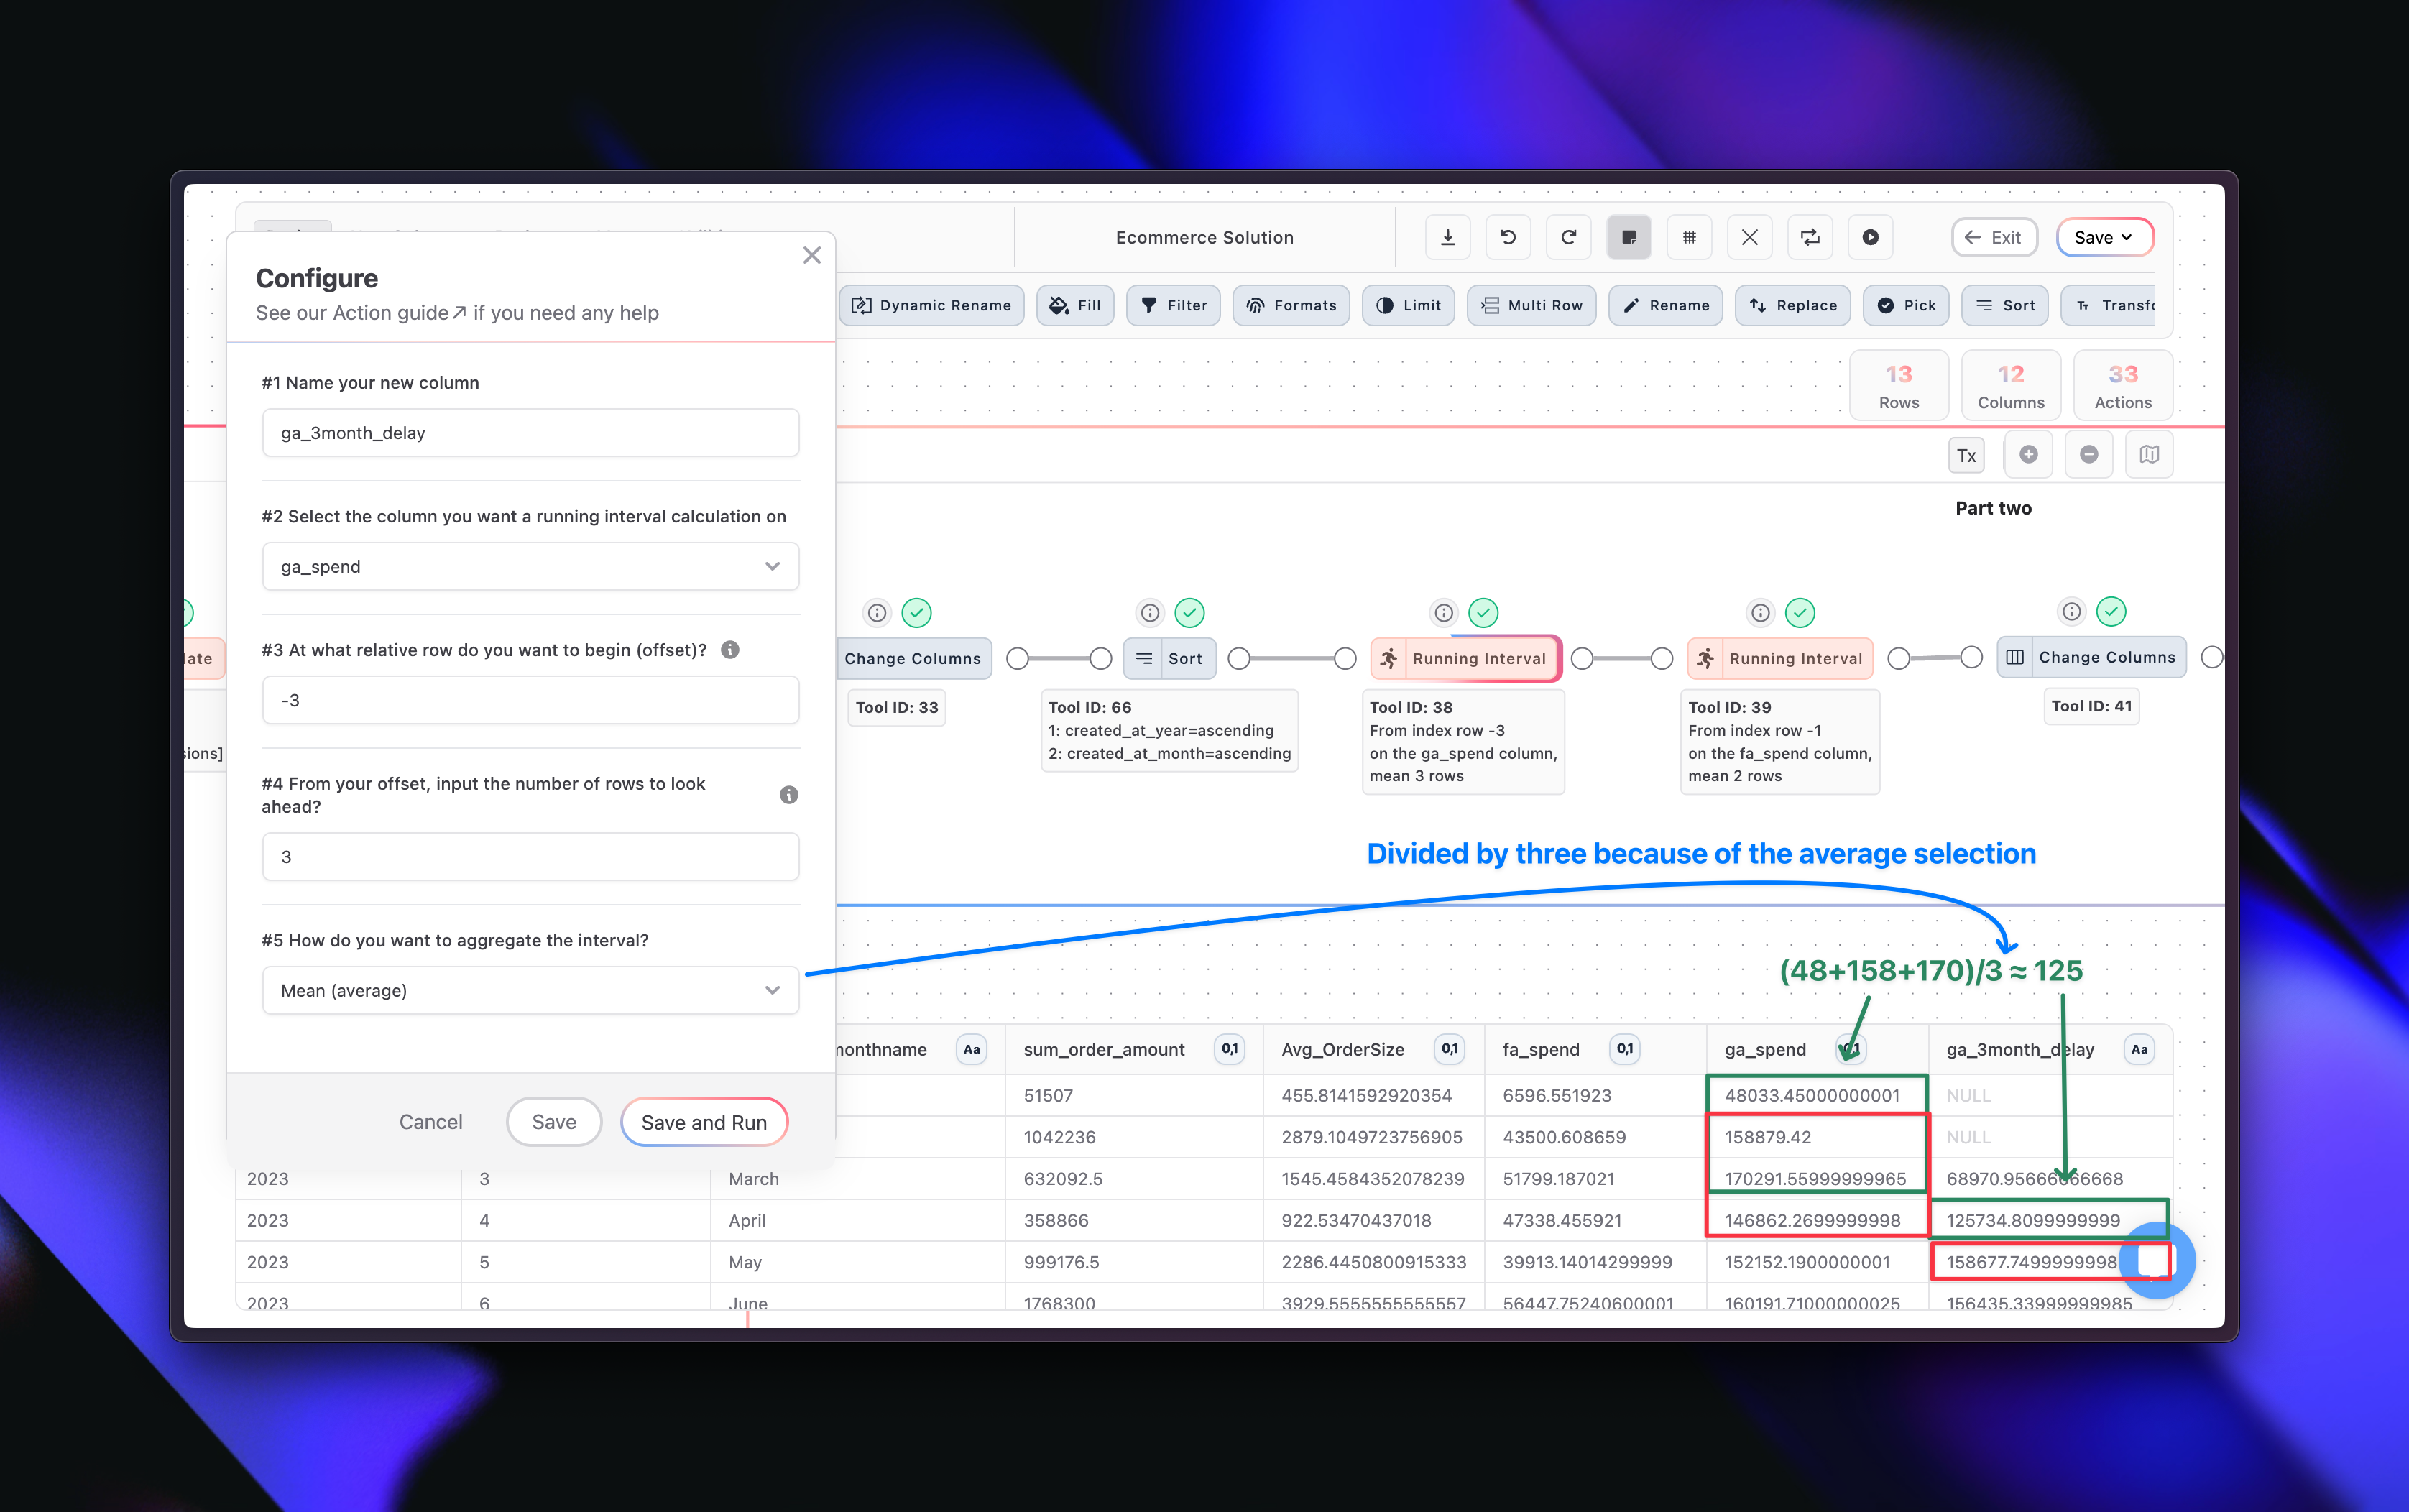
- GoogleAdSpend_i represents the Google Ad Spend at time i, where i ranges from t−3 to t−1 (last three months)
- FacebookAdSpend_i represents the Facebook Ad Spend at time i, where i ranges from t−1 to t (last month and current month)
Hint
Hint
The next and final step is the most complex. This is where we implement our ROAS formula. We’ll explain how to do the Google Ads calculation here.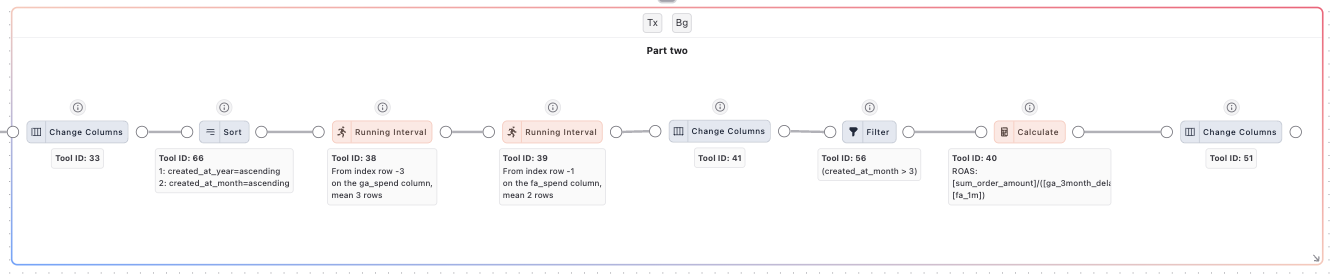
Solution File
Download the solution file here and see how to import it below. Remember to import it in a new model.