> ## Documentation Index
> Fetch the complete documentation index at: https://docs.less.tech/llms.txt
> Use this file to discover all available pages before exploring further.
# Running Interval
> Create custom running calculations
The Running Interval tool can be used to calculate custom running calculations. It can generate simple columns like 30 days running profit, but also other way cooler things like a custom customer acquisition cost metric.
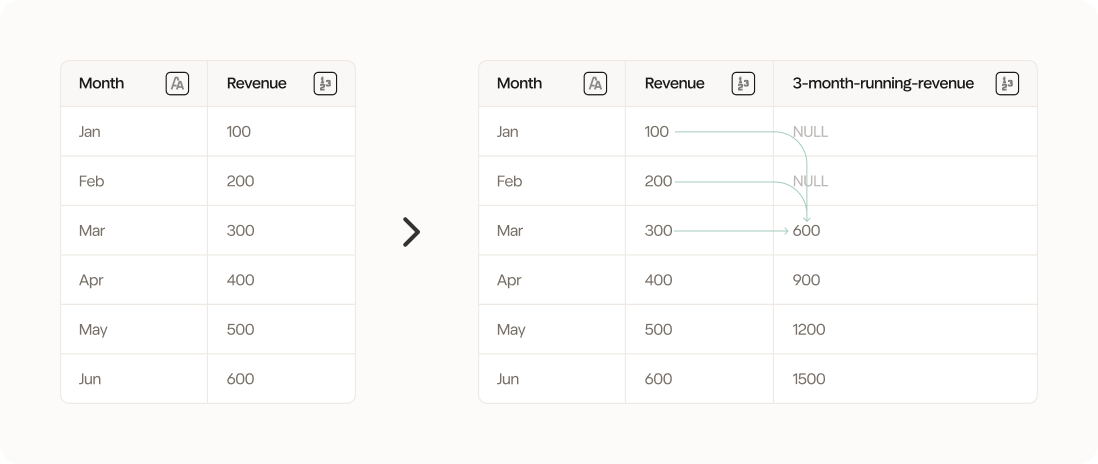 If you're looking for more ways to do row-wise calculations check out the [Compare](/tools/new-columns/compare), [Cumulative](/tools/new-columns/cumulative), or [Loop](/tools/utilities/loop) tool.
### Configuration
The Running Interval tool will create a new column. Use this input to name it.
Select the column you want to use for a running interval calculation.
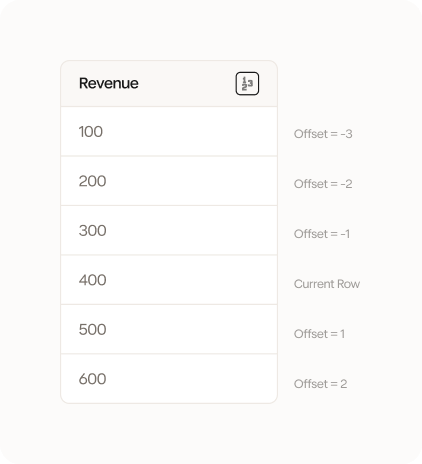
Input where you want your calculation to begin. Think of this as the row from your current row that your calculation should being. If you input -1 your calculation will always be calculated from your current row - 1 (understood vertically in your dataset).
If you're looking for more ways to do row-wise calculations check out the [Compare](/tools/new-columns/compare), [Cumulative](/tools/new-columns/cumulative), or [Loop](/tools/utilities/loop) tool.
### Configuration
The Running Interval tool will create a new column. Use this input to name it.
Select the column you want to use for a running interval calculation.
Input where you want your calculation to begin. Think of this as the row from your current row that your calculation should being. If you input -1 your calculation will always be calculated from your current row - 1 (understood vertically in your dataset).
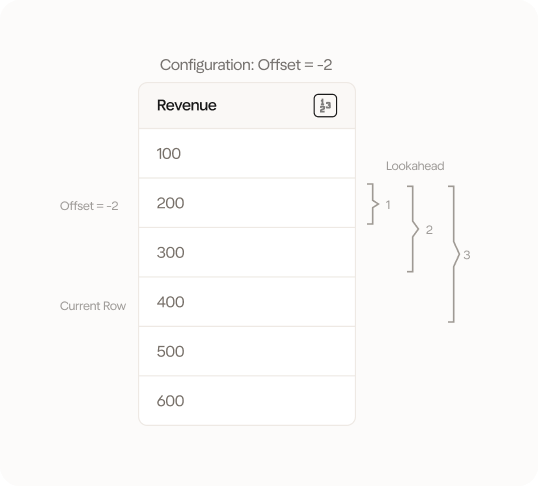
 Input how many rows you want to lookahead (or down in your dataset) from your offset. You can understand this and the previous input as creating a rolling range of data that you consider relevant.
 Select how you want to aggregate the range that you have created with your offset and lookahead input. You can choose between sum, average, min, max, count, median and variance.
Select the columns you want to group by. This will create a running interval for each group.
### Example: Simple running sum
Here we have a very simple example where we want to calculate the running sum of our *simple\_int* column.
We want to go back 2 rows and look ahead 3 rows.
We use the following configuration:
Select how you want to aggregate the range that you have created with your offset and lookahead input. You can choose between sum, average, min, max, count, median and variance.
Select the columns you want to group by. This will create a running interval for each group.
### Example: Simple running sum
Here we have a very simple example where we want to calculate the running sum of our *simple\_int* column.
We want to go back 2 rows and look ahead 3 rows.
We use the following configuration:
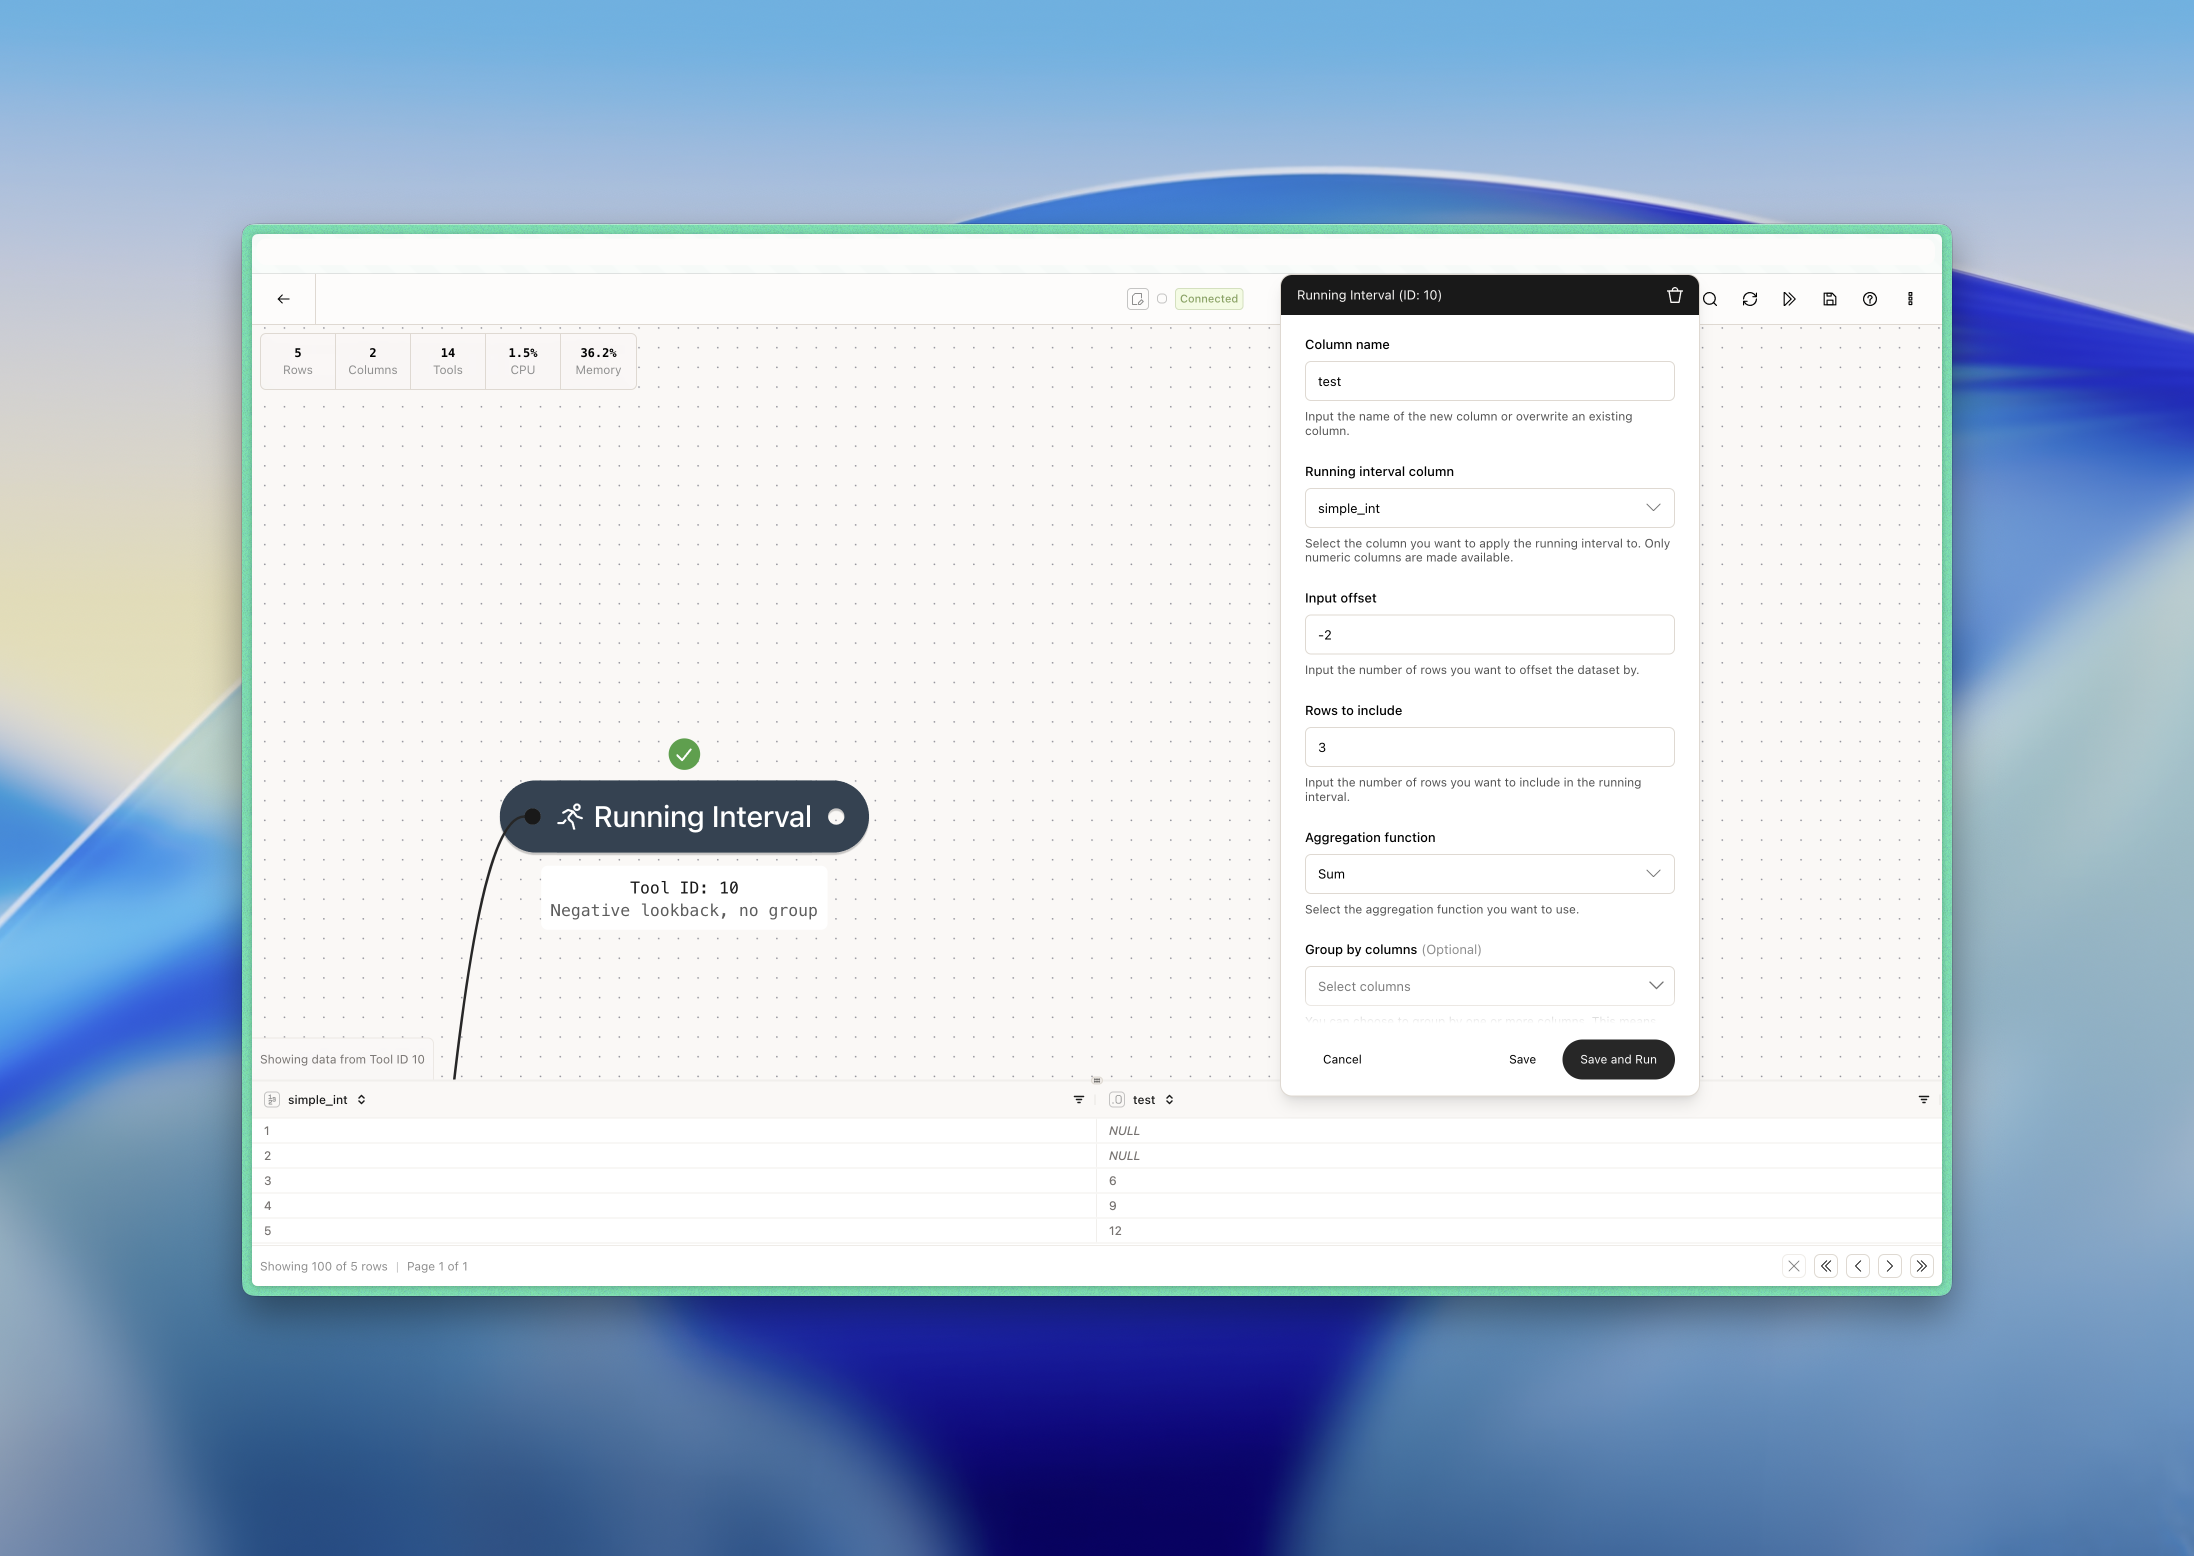 We see that the first two rows are null because we don't have enough rows to lookback. The remaining 3 rows are calculated with this logic:
* Row 3: 1+2+3 = 6
* Row 4: 2+3+4 = 9
* Row 5: 3+4+5 = 12
### Example: 3-month rolling average revenue
In this example, we want to calculate the 3-month rolling average of revenue to get a more even revenue trend and remove the worst seasonality. We want the previous, the current and the next months to be included in the calculation.
In addition, we want to group by segment which in this case is a region (EU vs. US).
We use the following configuration:
We see that the first two rows are null because we don't have enough rows to lookback. The remaining 3 rows are calculated with this logic:
* Row 3: 1+2+3 = 6
* Row 4: 2+3+4 = 9
* Row 5: 3+4+5 = 12
### Example: 3-month rolling average revenue
In this example, we want to calculate the 3-month rolling average of revenue to get a more even revenue trend and remove the worst seasonality. We want the previous, the current and the next months to be included in the calculation.
In addition, we want to group by segment which in this case is a region (EU vs. US).
We use the following configuration:
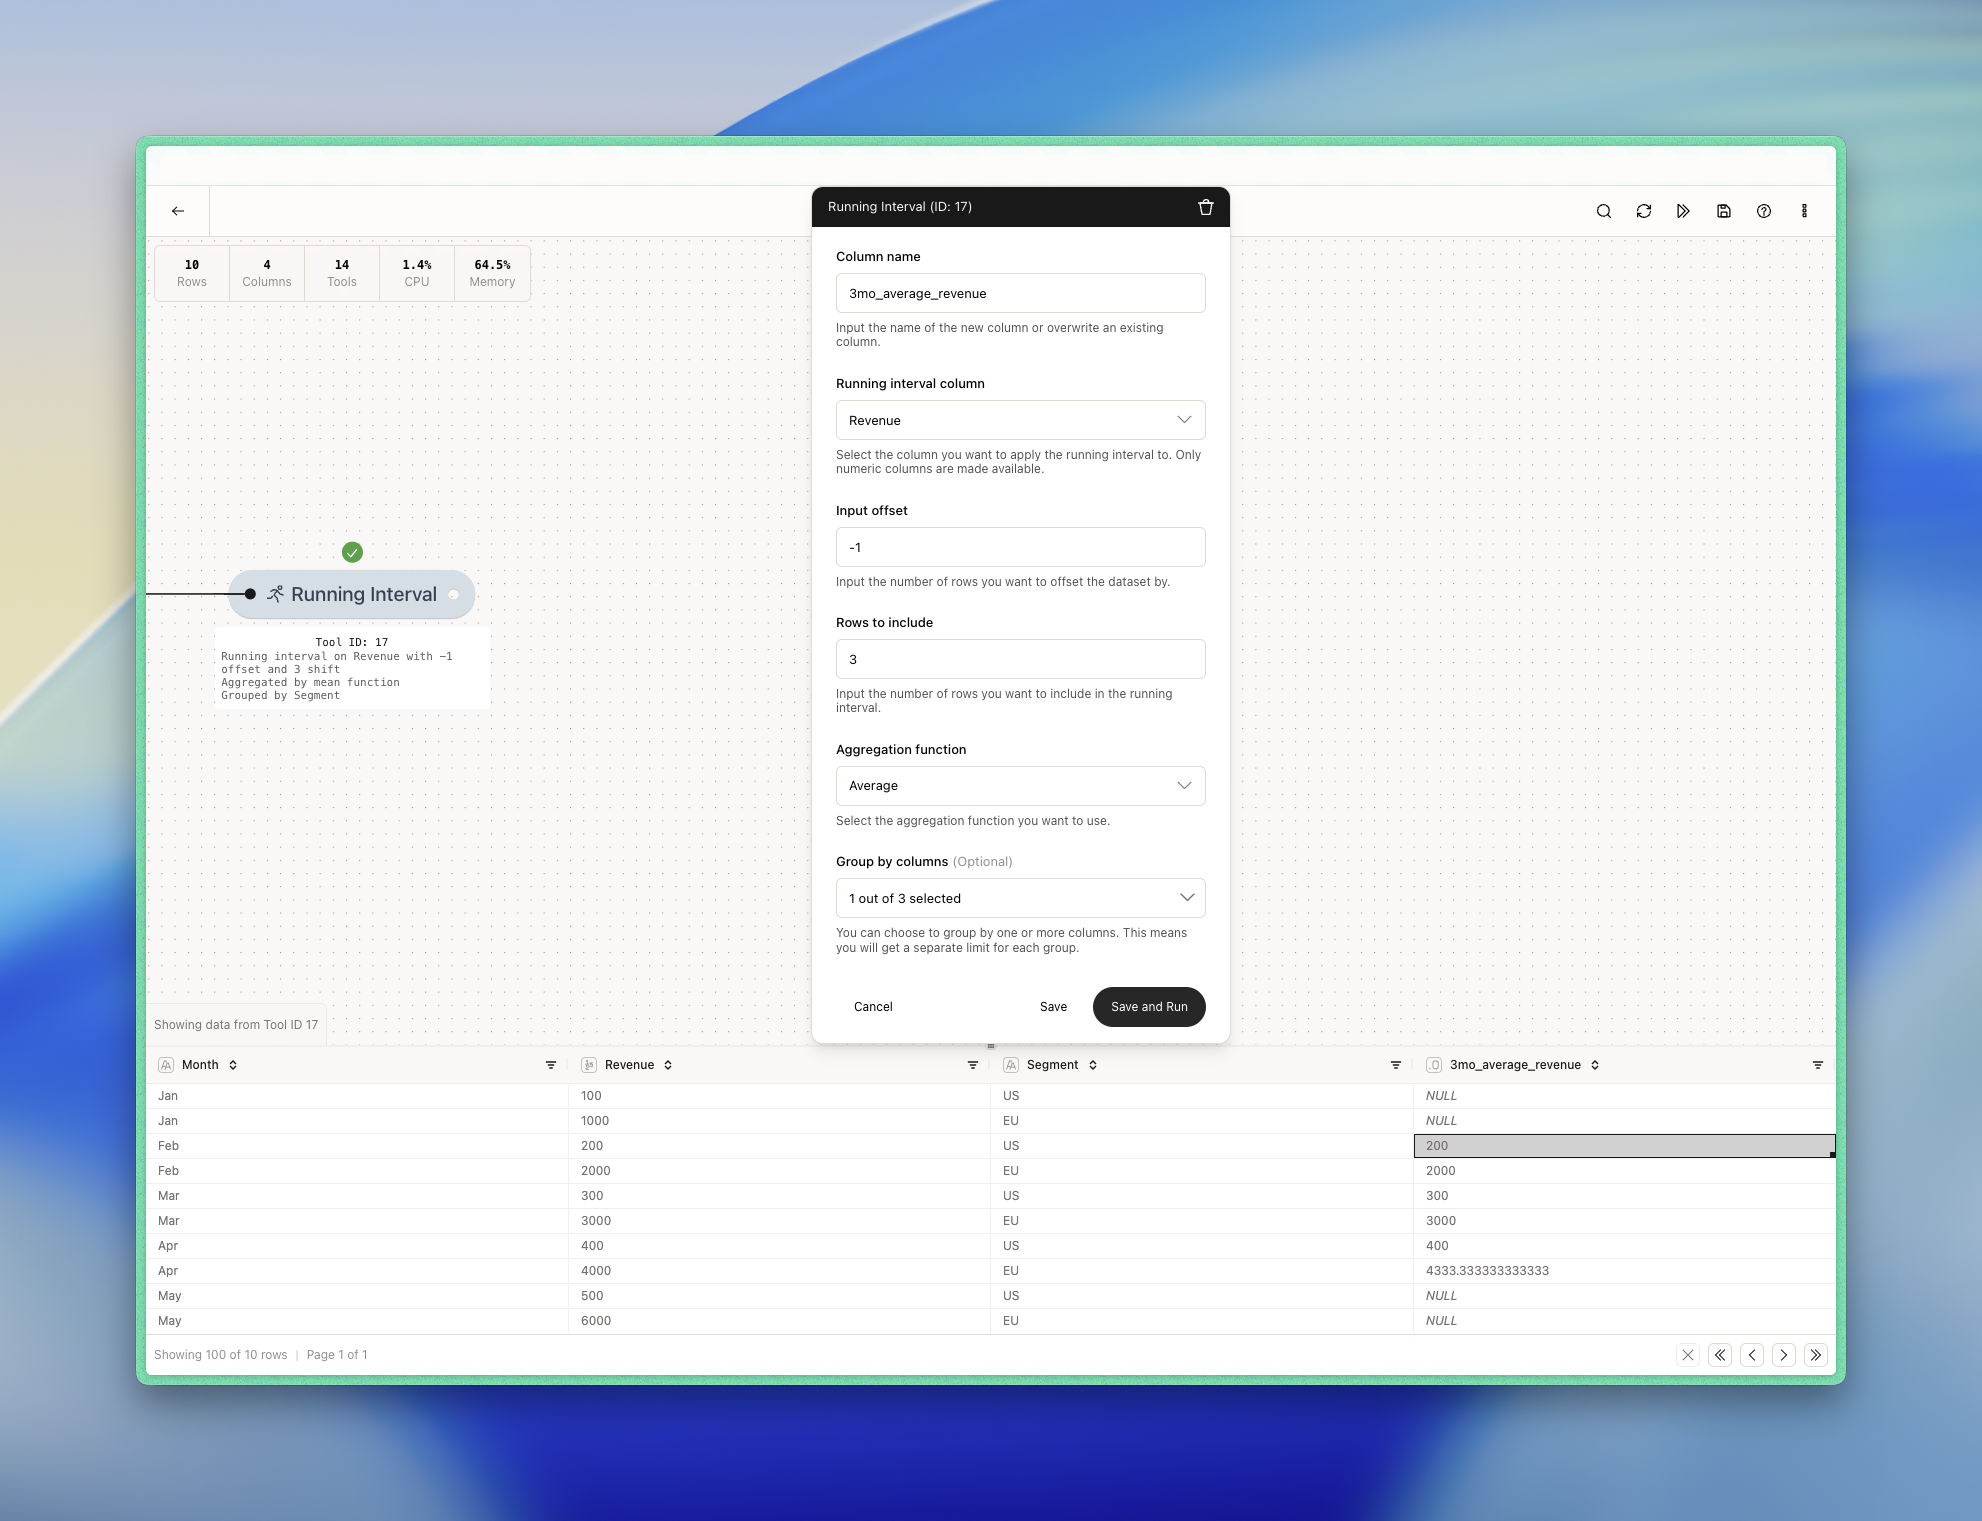 Try looking at row 3 (Feb, 200, US, 200). Here we implicitly do the following:
* Exclude row 2 because it's the current month and because it's the same region (US).
* So we jump one additional row up until we find an observation within the same group. We include row 1 because it's the same region (US) and it then becomes our previous row/month.
* We include row 3 because it's the current month and because it's the same region (US).
* We skip row 4 because for the same reason as row 2.
* We include row 5 because it's the next month and because it's the same region (US).
Row 1 has a value of 100, row 3 has a value of 200 and row 5 has a value of 300 whereby our average is (100 + 200 + 300) / 3 = 200.
Try looking at row 3 (Feb, 200, US, 200). Here we implicitly do the following:
* Exclude row 2 because it's the current month and because it's the same region (US).
* So we jump one additional row up until we find an observation within the same group. We include row 1 because it's the same region (US) and it then becomes our previous row/month.
* We include row 3 because it's the current month and because it's the same region (US).
* We skip row 4 because for the same reason as row 2.
* We include row 5 because it's the next month and because it's the same region (US).
Row 1 has a value of 100, row 3 has a value of 200 and row 5 has a value of 300 whereby our average is (100 + 200 + 300) / 3 = 200.