> ## Documentation Index
> Fetch the complete documentation index at: https://docs.less.tech/llms.txt
> Use this file to discover all available pages before exploring further.
# Functionality
We'll start with an overall run through of the Canvas. Below you can read more about additional options (the three dots in the top right corner).
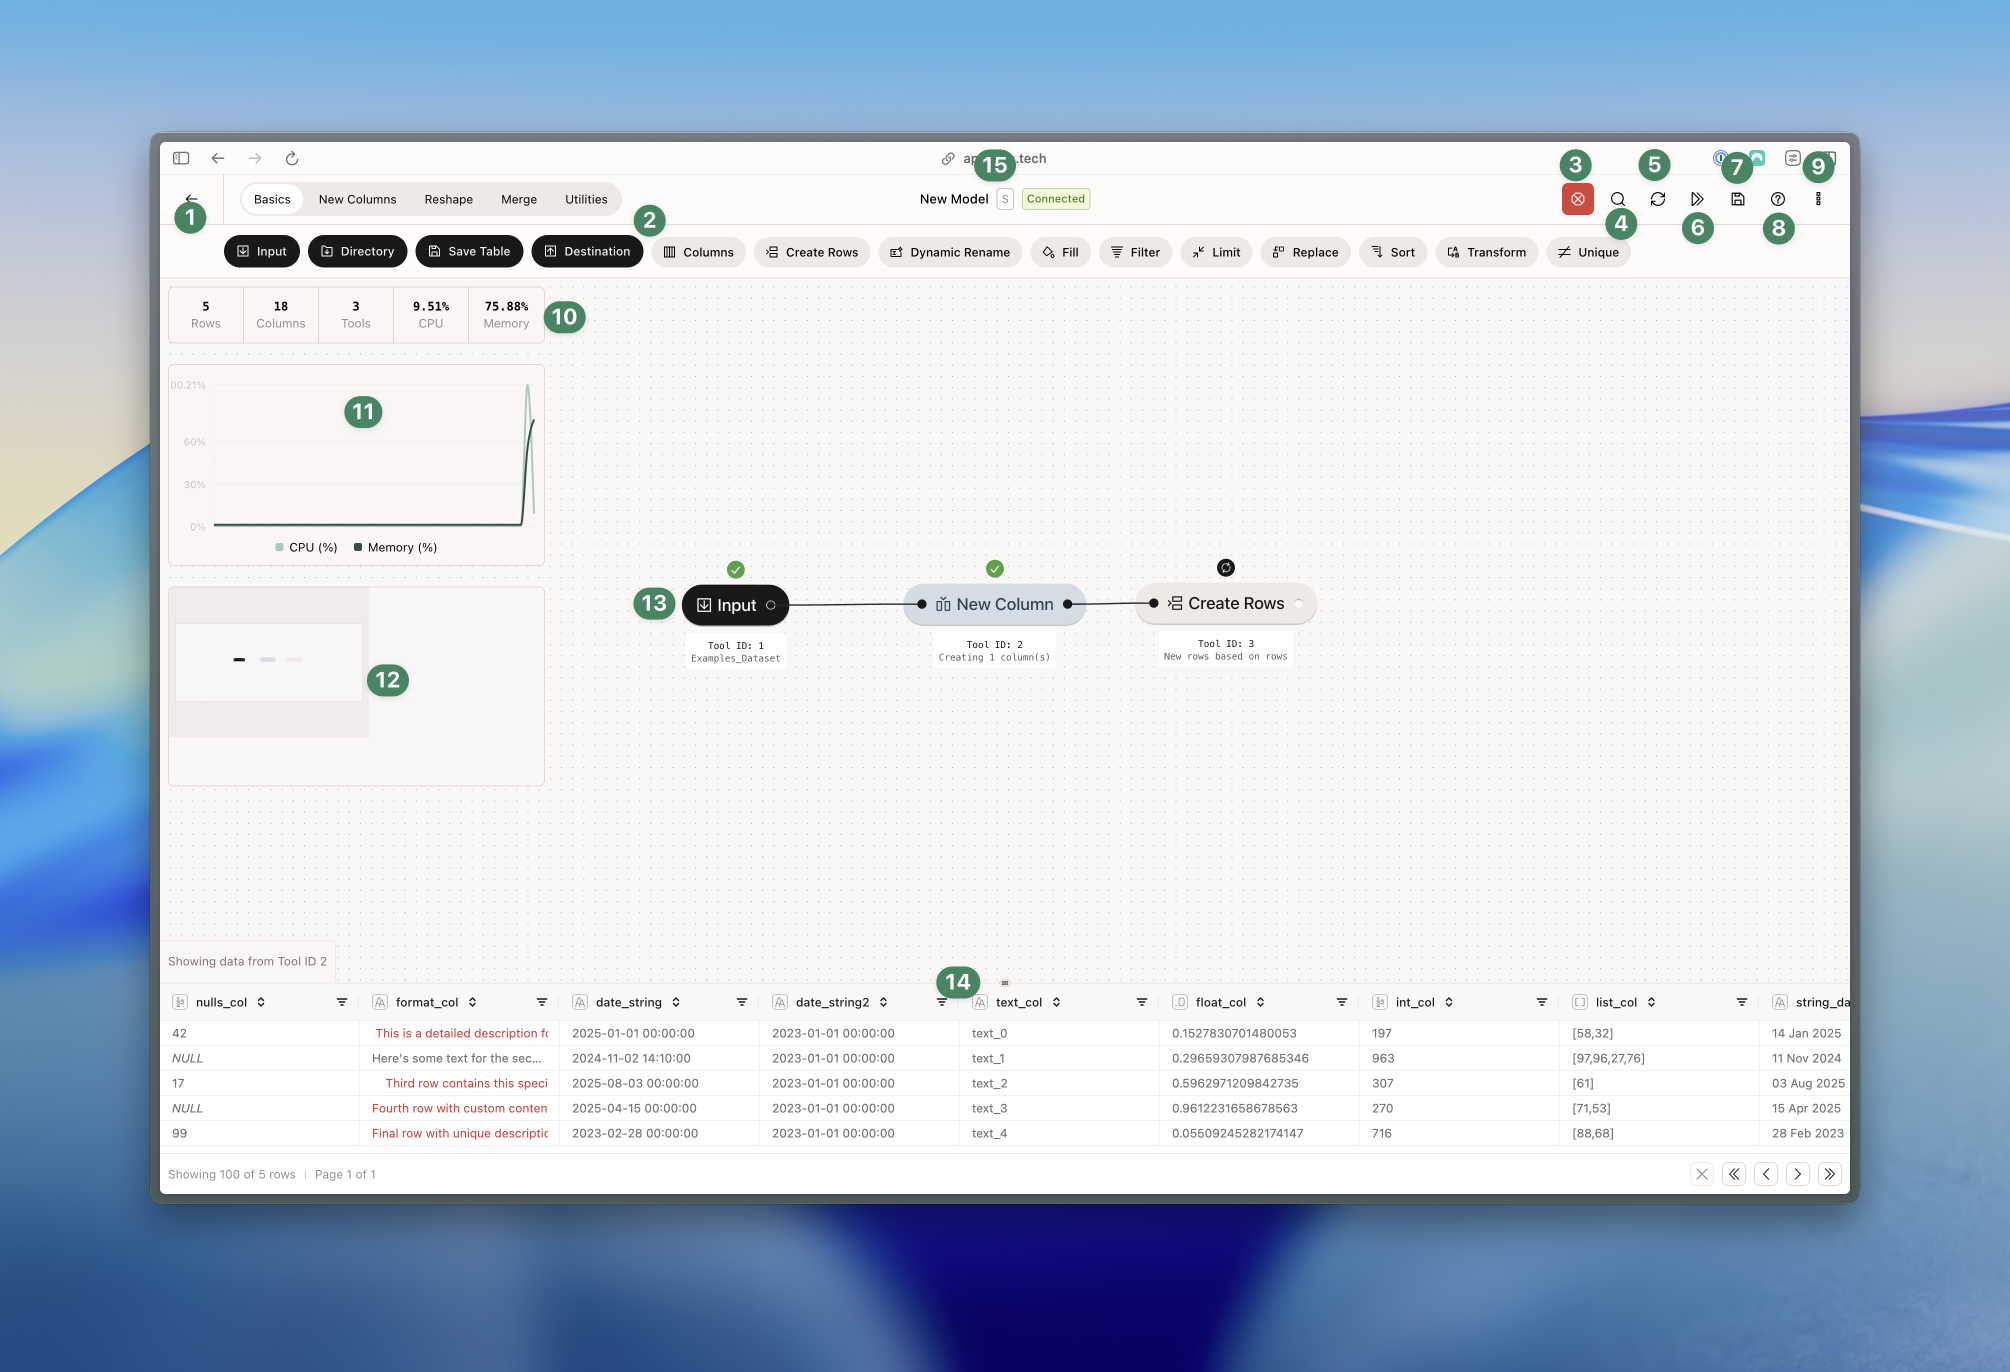 1. **Exit** the Canvas (remember to save your work)
2. This is the **toolbar**. You can switch between the different tabs (Basics, New Columns, etc.) in the top and drag tools from the bottom to the Canvas.
3. When a process is running, you can stop it by clicking the **stop** button.
4. Use this to search for tools. You can search by name and tool ID.
5. Here you can **clear your cache**. This is useful if you're experiencing performance issues or if you want to start fresh.
6. This **runs all your tools**.
7. Use this to **save** your model. You can also used CMD/CTRL+SHIFT+S to save your model. Read more about saving your model [here](/canvas/draft-publish).
8. Click this to open the **chat support**.
9. Additional option - read more below.
10. Here we have our **model metrics**. You can see the number of rows, columns and tools. You also see the current CPU and Memory utilization - these are updated every 2nd second. Read more about CPU, Memory and instances [here](/canvas/instances).
11. This is the **metrics chart**. It tracks CPU and memory usage in real-time and updates every 2nd second.
12. This is a **minimap** of the Canvas. It shows your current view and you can drag it around to change your view.
13. This is a **tool**. On top, you see the tool status (running, stopped, etc.). When you get closer to it, it switches to a setting wheel - you can click this to open the tool configuration. If you click on a tool, you run that particular tool. Below, you see the tool ID and annotations. You can edit the annotation by clicking on it (see more about documentation [here](/canvas/adding-documentation)).
14. Here we have the **data** showing you the data you're working with. Learn more about the data grid [here](/canvas/datagrid).
### Additional options
By clicking the three dots in the top right corner, you can access additional options.
1. **Exit** the Canvas (remember to save your work)
2. This is the **toolbar**. You can switch between the different tabs (Basics, New Columns, etc.) in the top and drag tools from the bottom to the Canvas.
3. When a process is running, you can stop it by clicking the **stop** button.
4. Use this to search for tools. You can search by name and tool ID.
5. Here you can **clear your cache**. This is useful if you're experiencing performance issues or if you want to start fresh.
6. This **runs all your tools**.
7. Use this to **save** your model. You can also used CMD/CTRL+SHIFT+S to save your model. Read more about saving your model [here](/canvas/draft-publish).
8. Click this to open the **chat support**.
9. Additional option - read more below.
10. Here we have our **model metrics**. You can see the number of rows, columns and tools. You also see the current CPU and Memory utilization - these are updated every 2nd second. Read more about CPU, Memory and instances [here](/canvas/instances).
11. This is the **metrics chart**. It tracks CPU and memory usage in real-time and updates every 2nd second.
12. This is a **minimap** of the Canvas. It shows your current view and you can drag it around to change your view.
13. This is a **tool**. On top, you see the tool status (running, stopped, etc.). When you get closer to it, it switches to a setting wheel - you can click this to open the tool configuration. If you click on a tool, you run that particular tool. Below, you see the tool ID and annotations. You can edit the annotation by clicking on it (see more about documentation [here](/canvas/adding-documentation)).
14. Here we have the **data** showing you the data you're working with. Learn more about the data grid [here](/canvas/datagrid).
### Additional options
By clicking the three dots in the top right corner, you can access additional options.
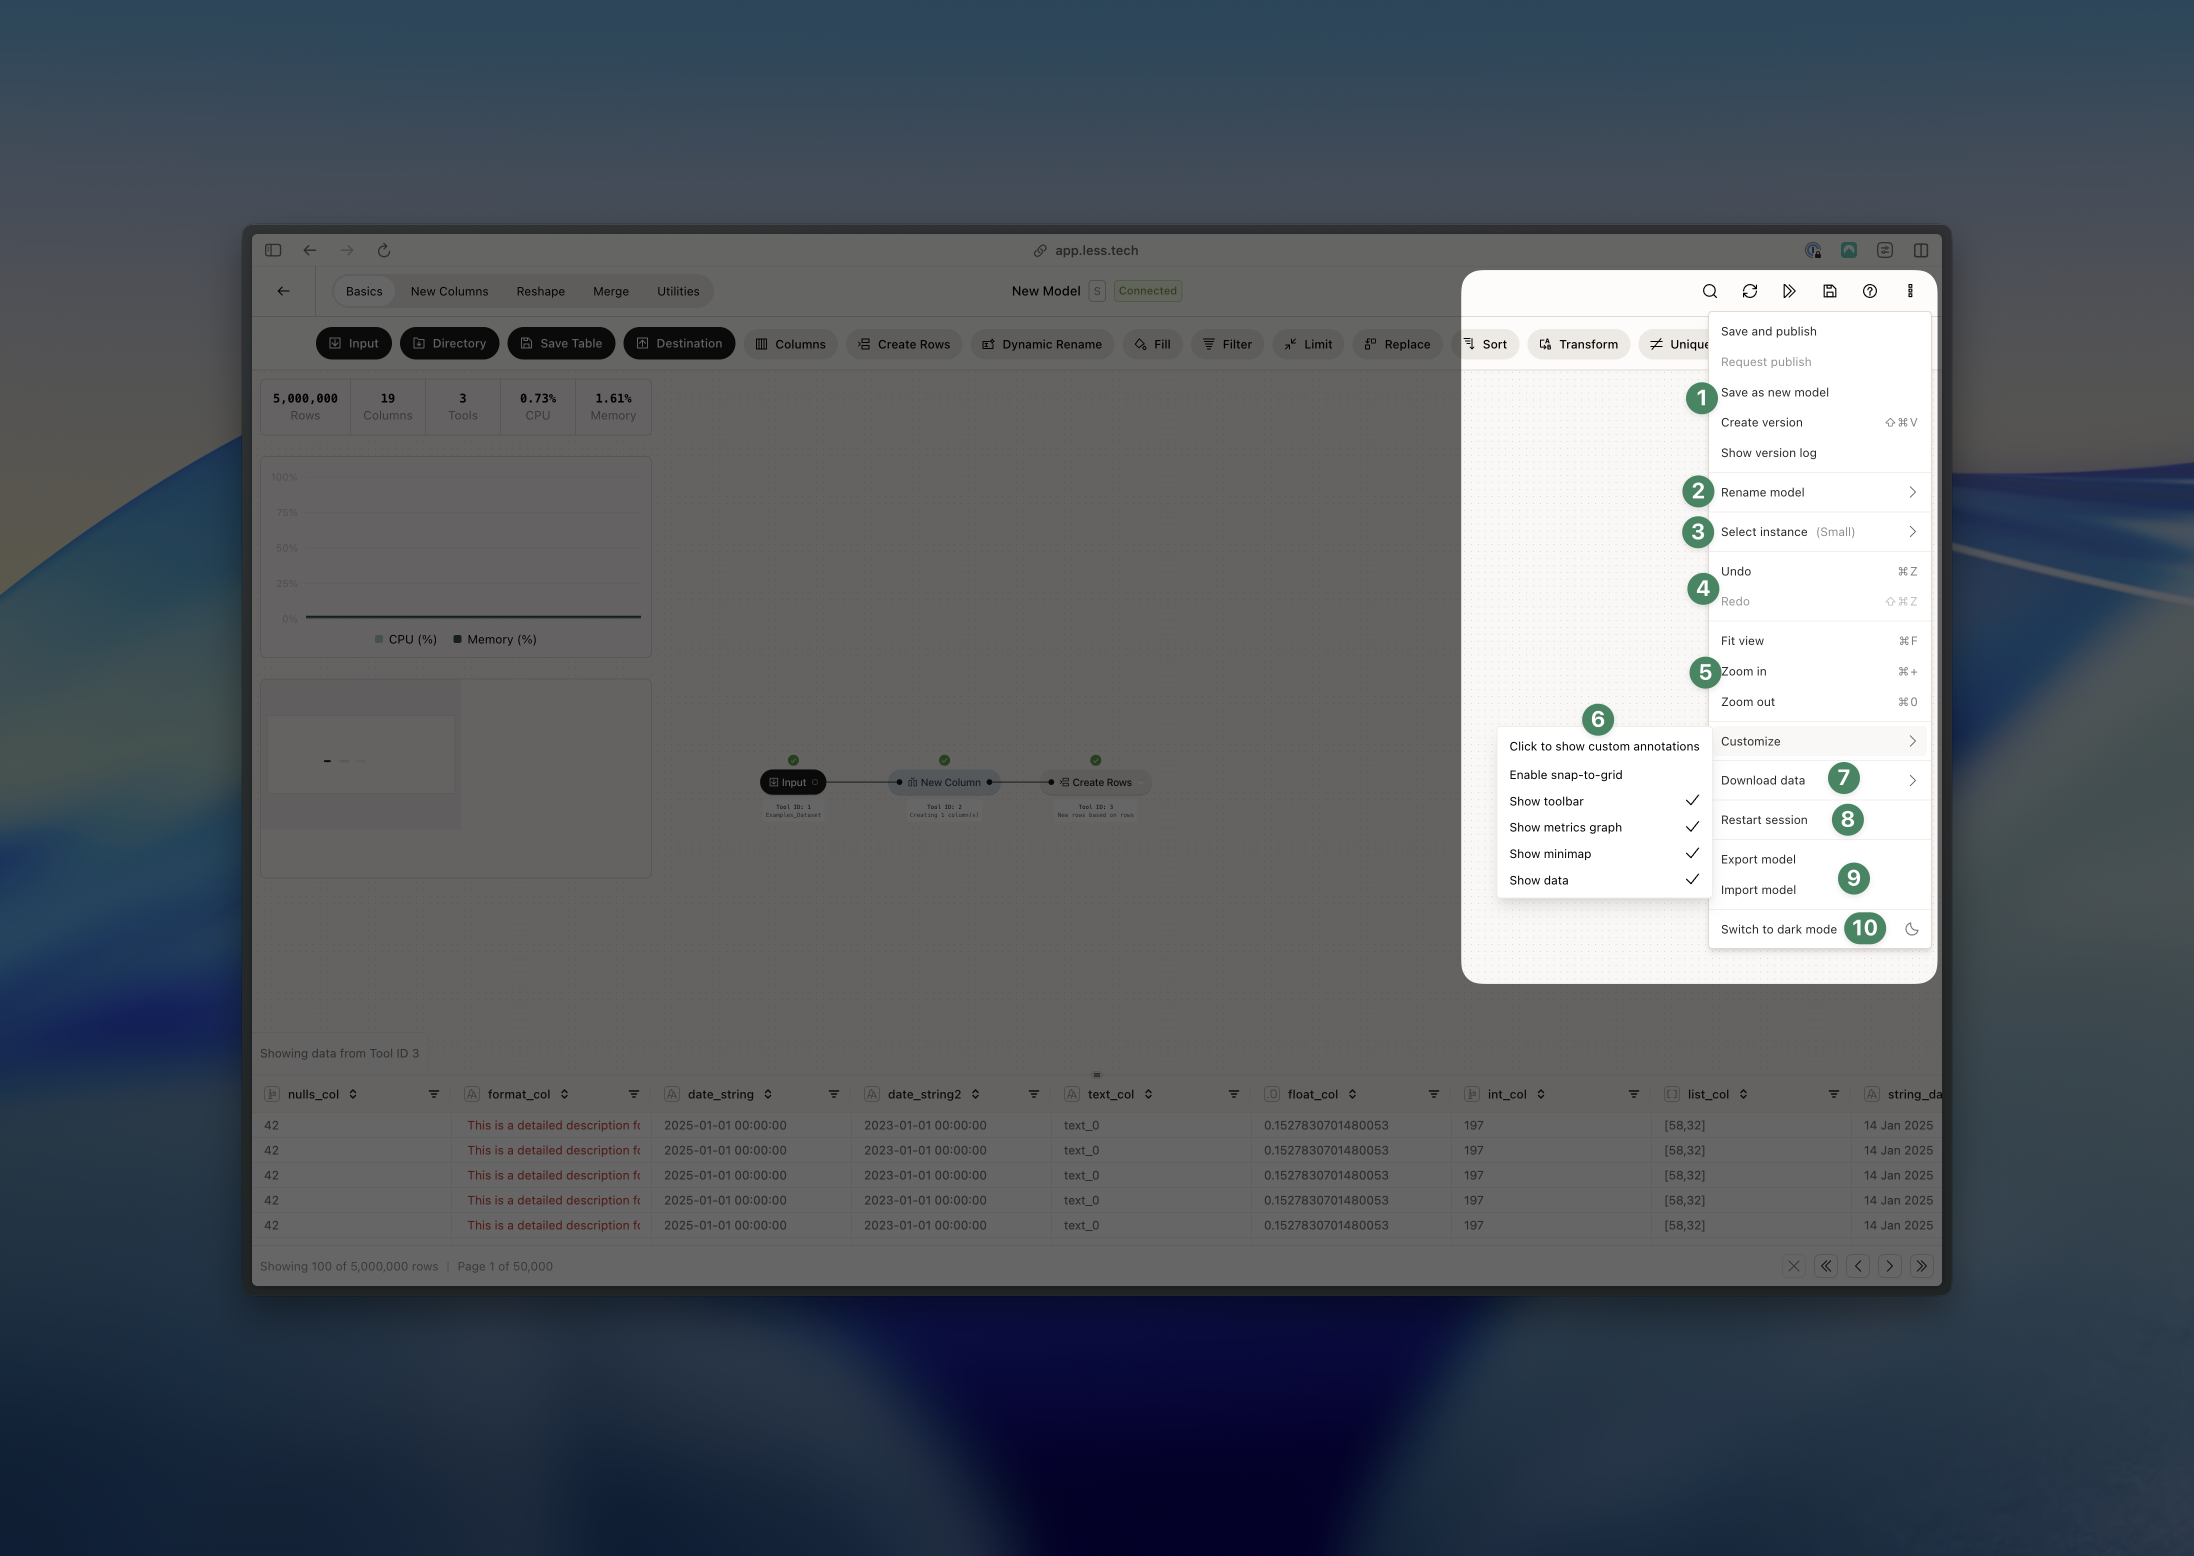 1. The first five options are related to version, saving, and draft/publish. Read more about that here [here](/canvas/draft-publish).
2. Here you can **rename** your model.
3. Change you **instance size** - read more about instances [here](/canvas/instances).
4. Use this to undo / redo your changes. You can also use CMD/CTRL+Z and CMD/CTRL+Y to undo / redo your changes.
5. Here you can fit your view to your tools - you can also use CMD/CTRL+F. You can also zoom in and out (also using CMD/CTRL++ and CMD/CTRL+0).
6. Customize your Canvas: you can show all/custom/no annotations, enable/disabled snap-to-grid, show/hide the toolbar, show/hide the metrics chart, show/hide the minimap and show/hide the datagrid.
7. Download your data as either a CSV or Excel file. File size is limited to 20.000.000 cells (rows \* columns) - anything above that will fail.
8. Use this to **restart your session**
9. Here you can **export** your model as JSON file or **import** a model.
10. Switch between light/dark mode.
1. The first five options are related to version, saving, and draft/publish. Read more about that here [here](/canvas/draft-publish).
2. Here you can **rename** your model.
3. Change you **instance size** - read more about instances [here](/canvas/instances).
4. Use this to undo / redo your changes. You can also use CMD/CTRL+Z and CMD/CTRL+Y to undo / redo your changes.
5. Here you can fit your view to your tools - you can also use CMD/CTRL+F. You can also zoom in and out (also using CMD/CTRL++ and CMD/CTRL+0).
6. Customize your Canvas: you can show all/custom/no annotations, enable/disabled snap-to-grid, show/hide the toolbar, show/hide the metrics chart, show/hide the minimap and show/hide the datagrid.
7. Download your data as either a CSV or Excel file. File size is limited to 20.000.000 cells (rows \* columns) - anything above that will fail.
8. Use this to **restart your session**
9. Here you can **export** your model as JSON file or **import** a model.
10. Switch between light/dark mode.