> ## Documentation Index
> Fetch the complete documentation index at: https://docs.less.tech/llms.txt
> Use this file to discover all available pages before exploring further.
# Data Grid
> View and interact with your data
### Overview
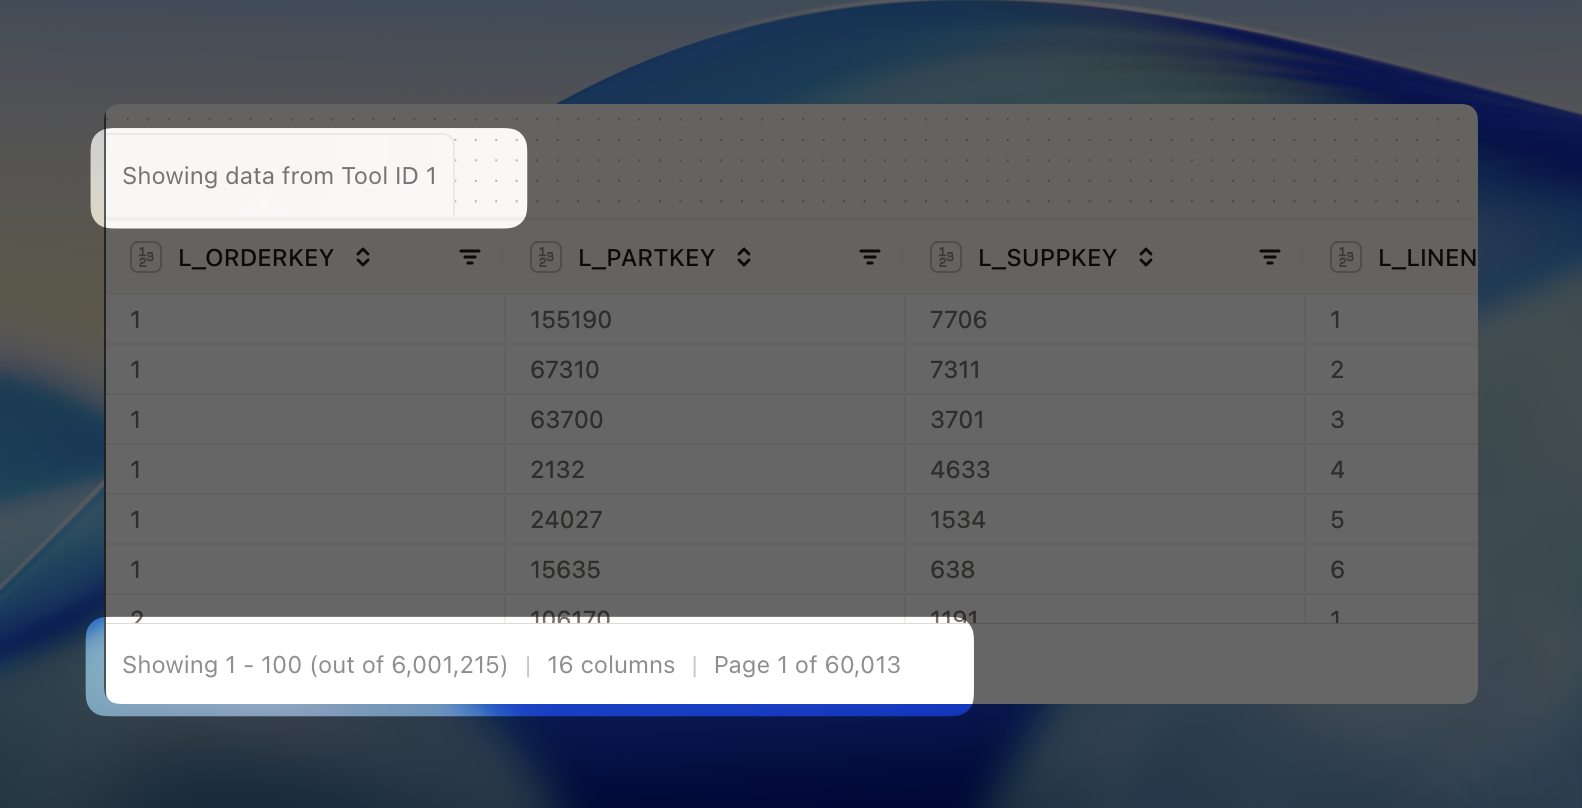
You can also easily see which tool you seeing data from. Similarly, you can see the number of rows and columns in the data grid.
 ### Data types
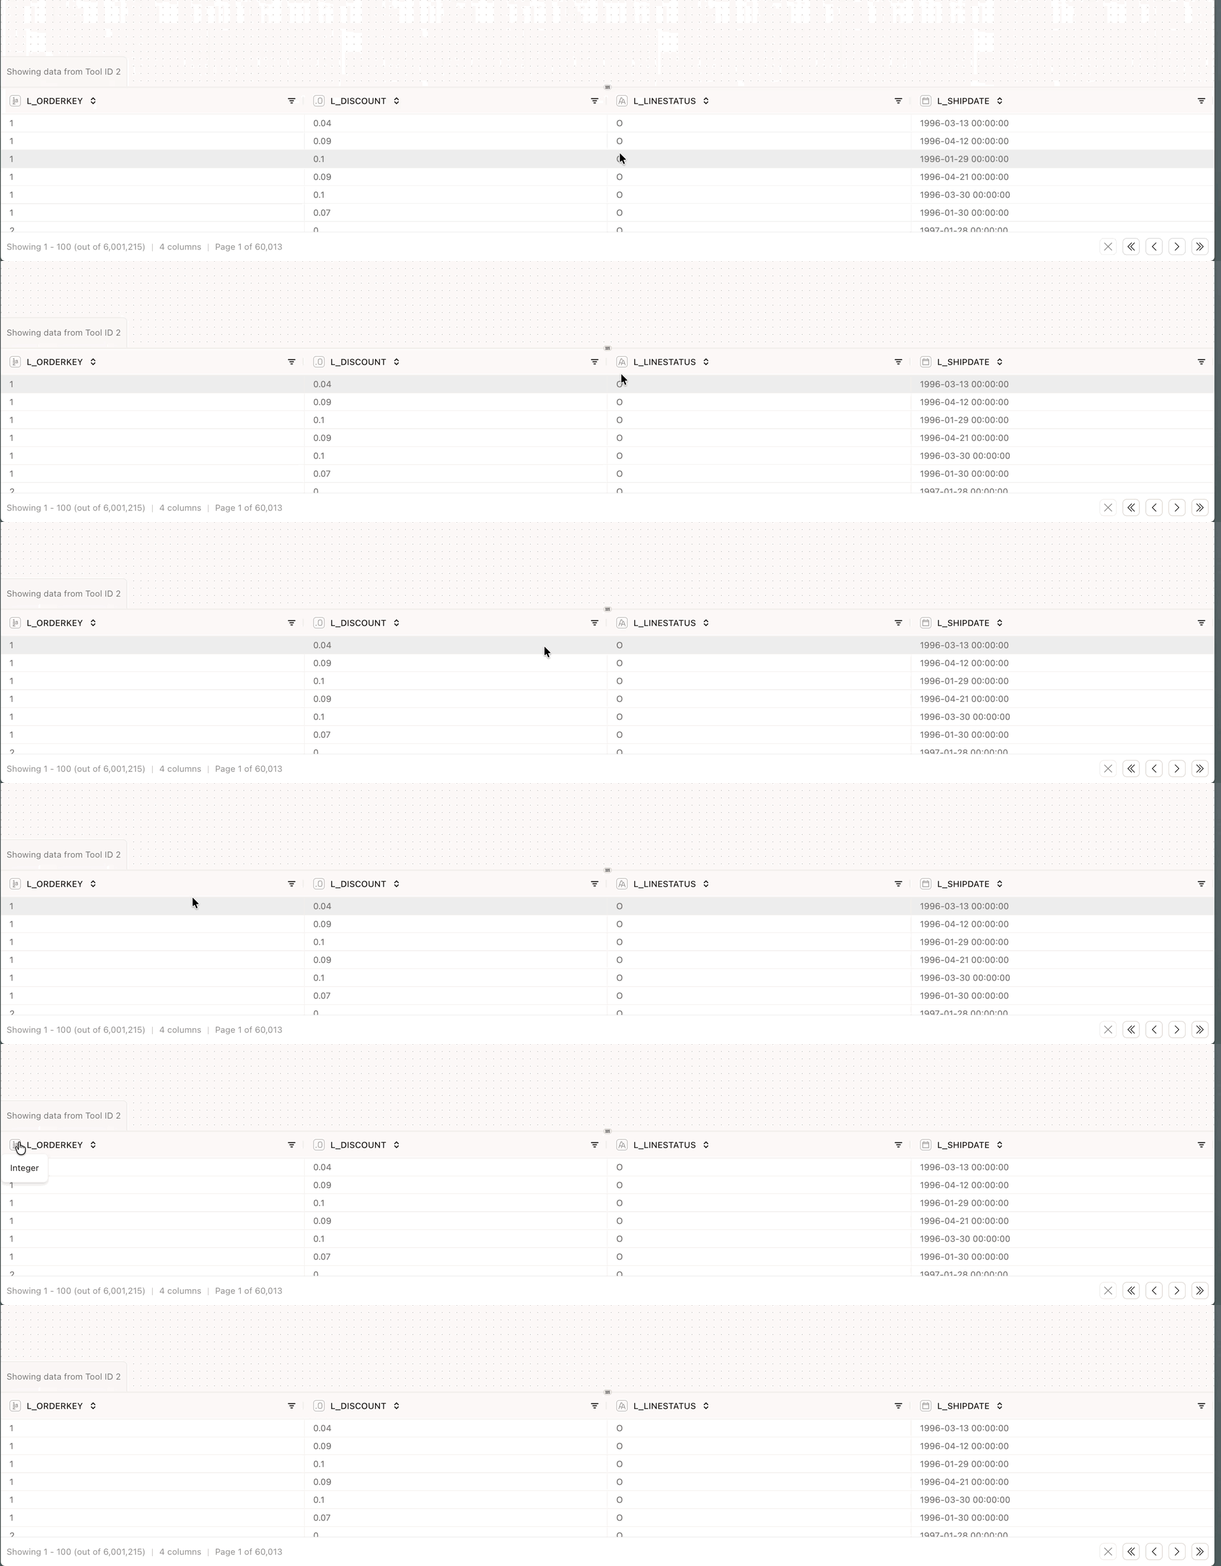
Data types are automatically detected and displayed in the data grid. Simply hover the icon to see the data type.
### Data types
Data types are automatically detected and displayed in the data grid. Simply hover the icon to see the data type.
 ### Trailing spaces and tabs
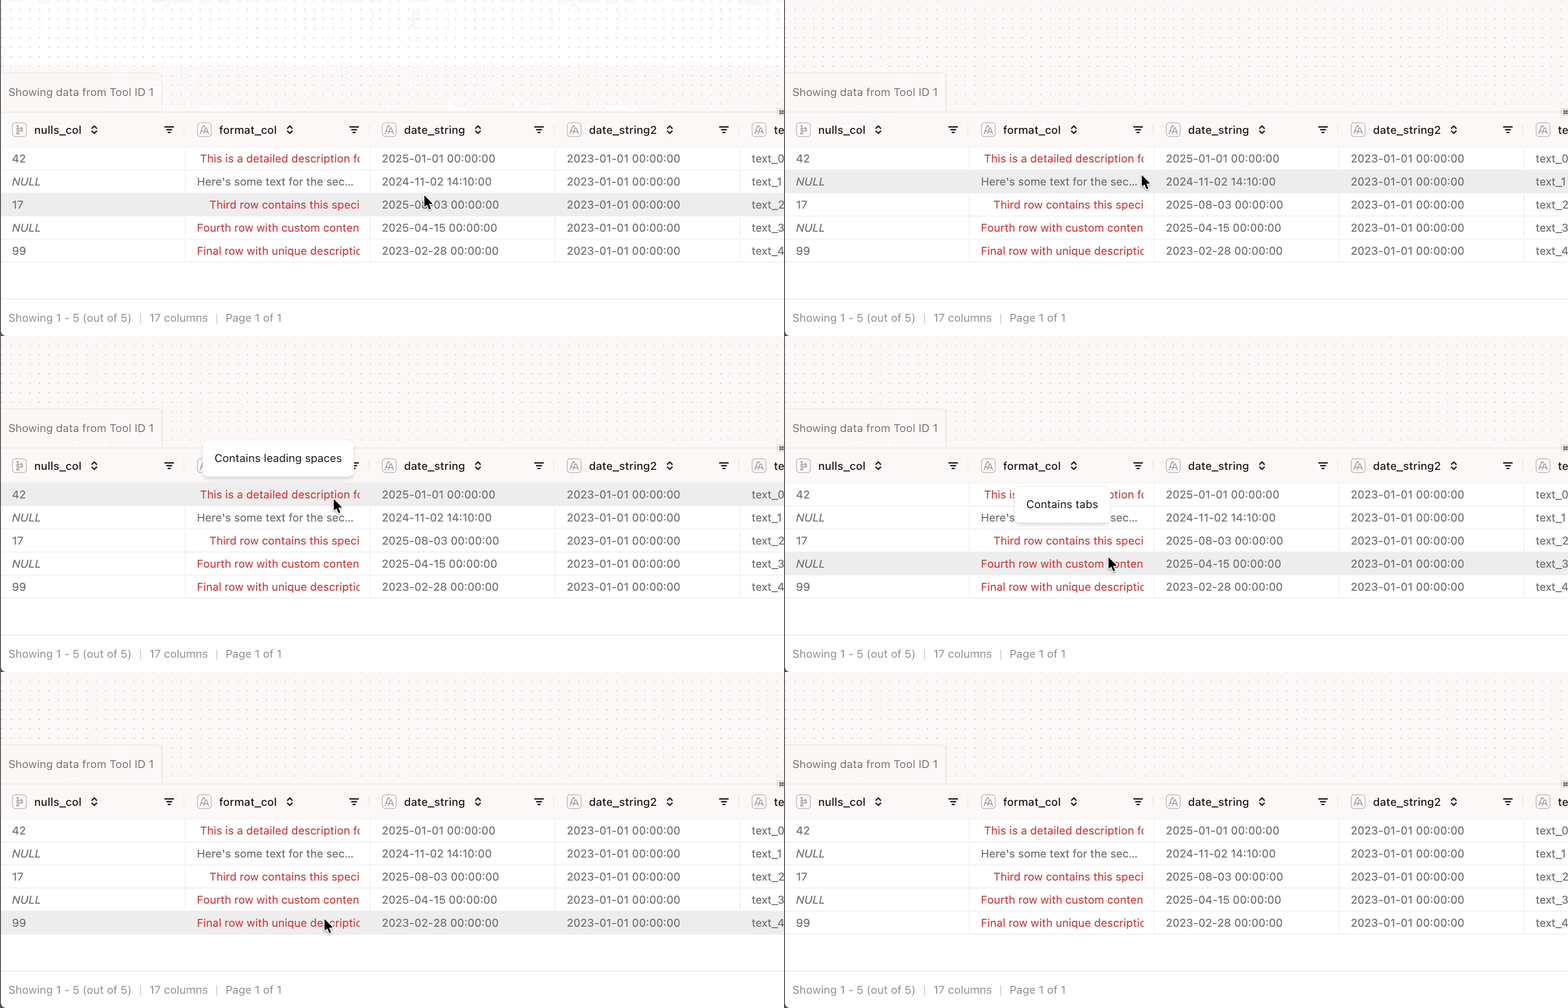
If a cell contains trailing spaces, newlines or tabs, you can easily spot them. The text will be highlighted in red and you can hover to see what you need to pay attention to.
### Trailing spaces and tabs
If a cell contains trailing spaces, newlines or tabs, you can easily spot them. The text will be highlighted in red and you can hover to see what you need to pay attention to.
 ### Filtering
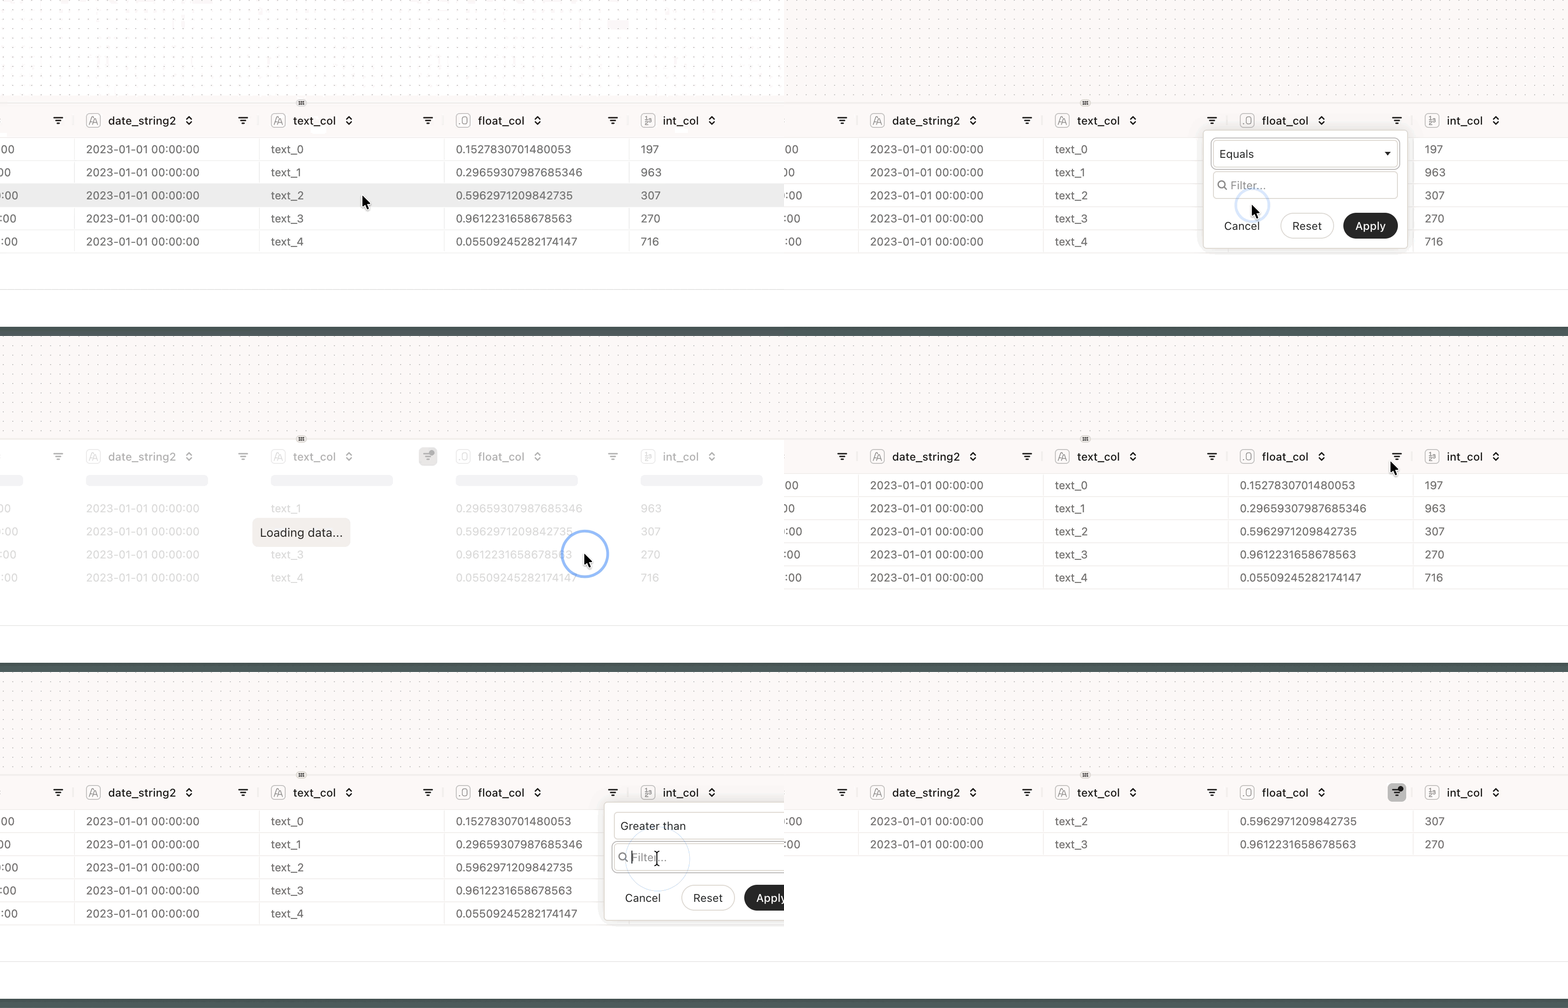
It might be helpful to inspect your data before you begin building your model. The data grid allows you to filter your data based on the values in the columns. Note that you're filtering the **full** dataset and not just the first page.
You can add multiple filters to the data grid that are all applied to the dataset.
### Filtering
It might be helpful to inspect your data before you begin building your model. The data grid allows you to filter your data based on the values in the columns. Note that you're filtering the **full** dataset and not just the first page.
You can add multiple filters to the data grid that are all applied to the dataset.
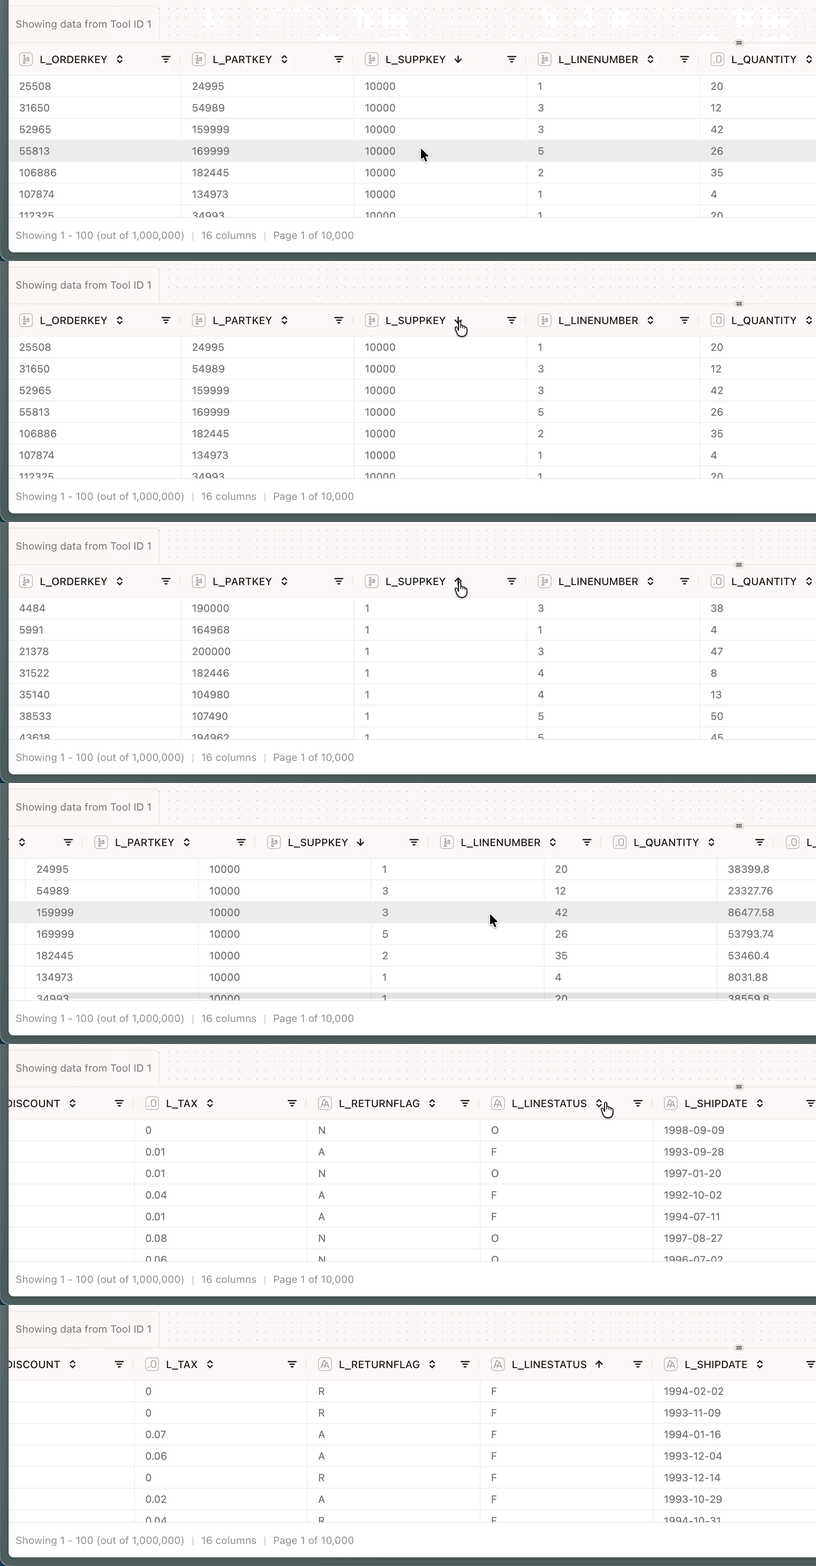
 ### Sorting
Like filtering, it might be helpful to sort your data to get to know your data better. The data grid allows you to sort your data based on the values in the columns.
### Sorting
Like filtering, it might be helpful to sort your data to get to know your data better. The data grid allows you to sort your data based on the values in the columns.
 ### Anchors
Some tools have multiple outputs - we call these anchors. For instance, a [Unique](/tools/basics/unique) contains two outputs: the unique values and the duplicate values. These anchors are also shown in the data grid and enable you to easily switch between the views.
### Anchors
Some tools have multiple outputs - we call these anchors. For instance, a [Unique](/tools/basics/unique) contains two outputs: the unique values and the duplicate values. These anchors are also shown in the data grid and enable you to easily switch between the views.
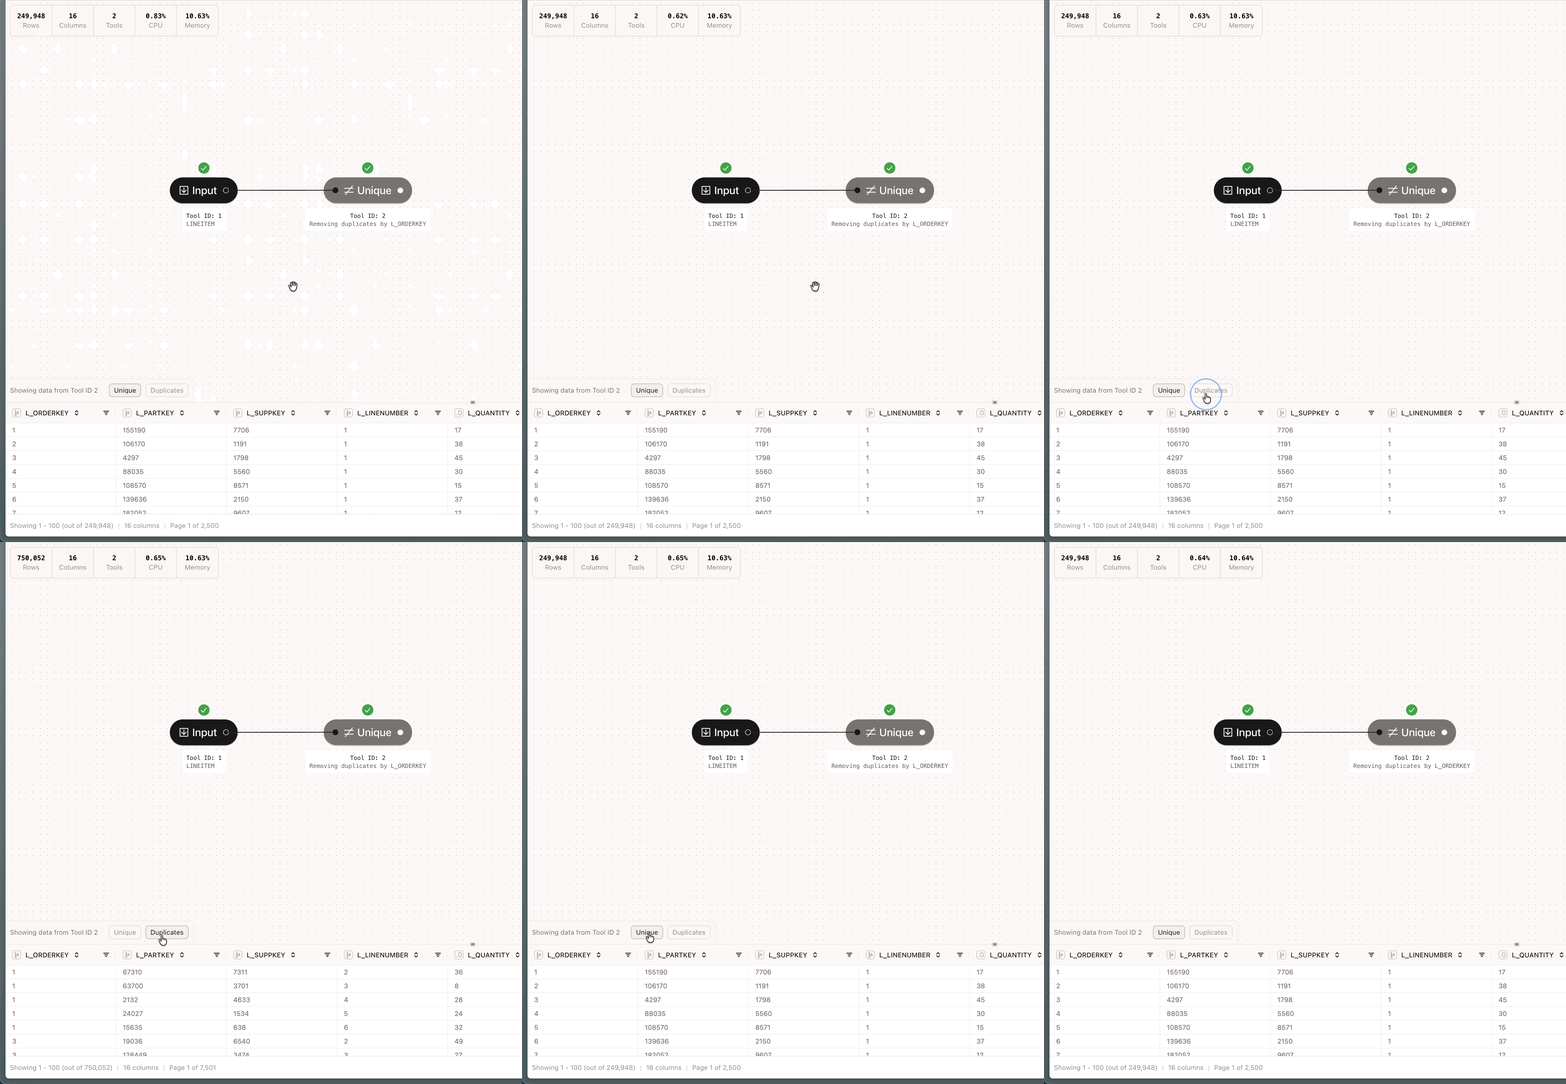 [Combine](/tools/merge/combine), [Filter](/tools/basics/filter), [Unique](/tools/basics/unique), [Add Business Days](/tools/new-columns/add-business-days), [Count Business Days](/tools/new-columns/count-business-days) and the [Loop](/tools/utilities/loop) tool have multiple anchors.
### Pagination
You can navigate through the pages of the data grid using the pagination controls at the bottom-right of the data grid.
[Combine](/tools/merge/combine), [Filter](/tools/basics/filter), [Unique](/tools/basics/unique), [Add Business Days](/tools/new-columns/add-business-days), [Count Business Days](/tools/new-columns/count-business-days) and the [Loop](/tools/utilities/loop) tool have multiple anchors.
### Pagination
You can navigate through the pages of the data grid using the pagination controls at the bottom-right of the data grid.
